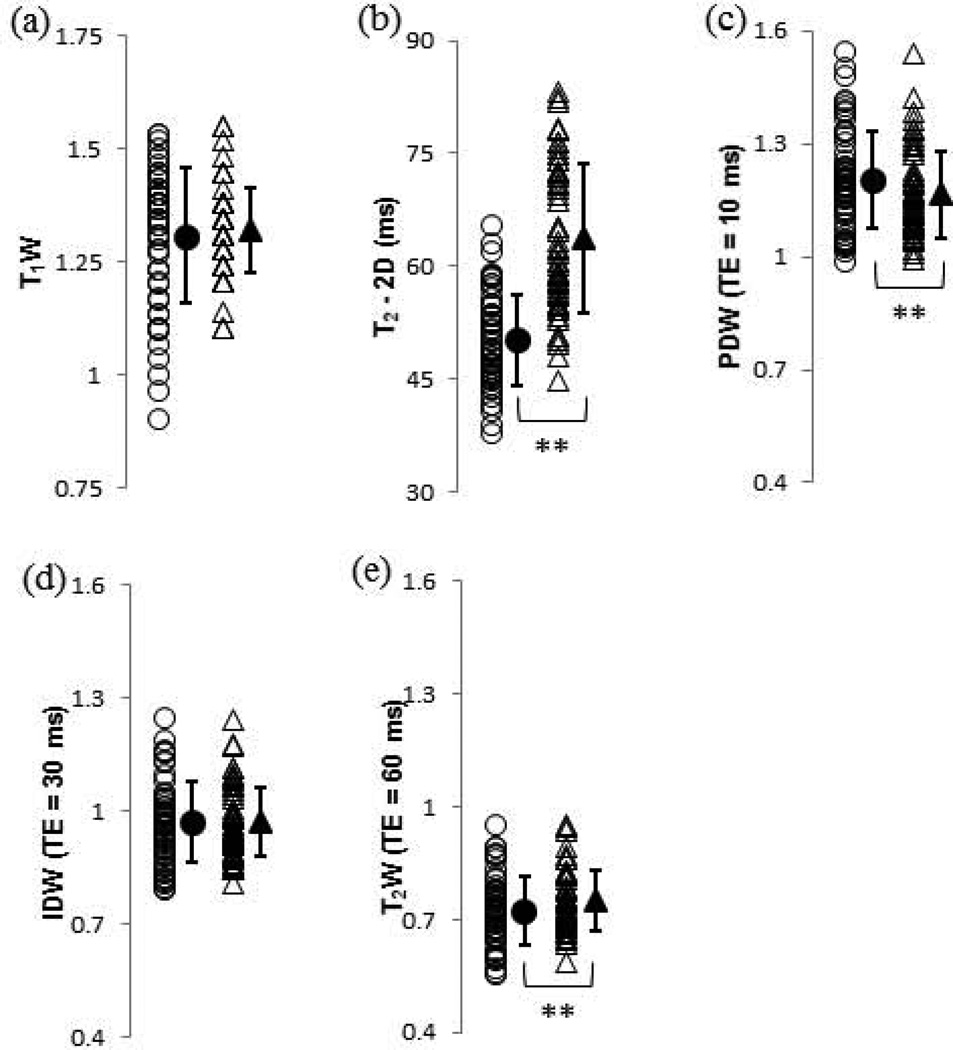
FIGURE 3.
Values of the DPBS-normalized T1 weighted MRI measurements, T2 relaxation time, and T2 weighted MRI measurements obtained using the OAI protocol for control (open circles) and 2.5-h trypsin degraded (open triangles) BNC samples. Group means and standard deviations are shown as adjacent solid shapes and error bars. (a) T1W; (b) T2 – 2D (ms); (c) PDW (TE = 10 ms); (d) IDW (TE = 30 ms) and (e) T2W (TE = 60 ms). * p < 0.05 control vs. 2.5-h trypsin, ** p < 0.01 control vs. 2.5-h trypsin

