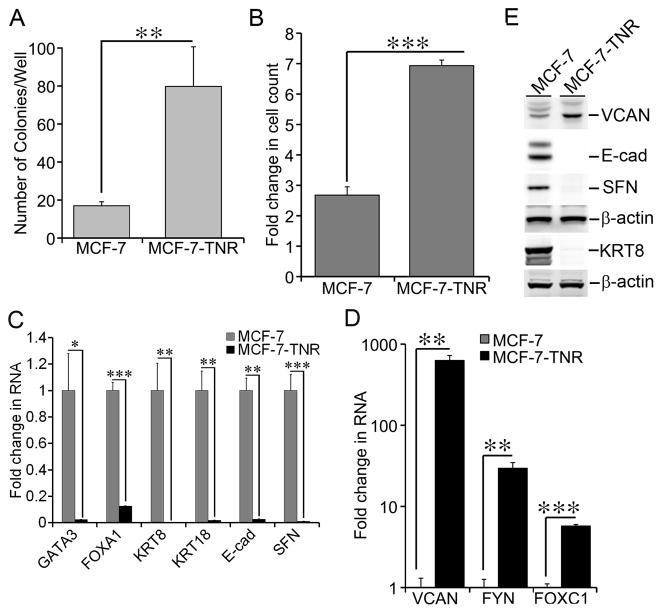
Figure 1. Dysregulated growth and gene expression in MCF-7-TNR cells.
A) Growth of MCF-7 and MCF-7-TNR cells was compared using soft agar colony formation assays. After three weeks of culture in soft agar, the colonies formed by each cell line were enumerated and compared. B) Proliferation of MCF-7 and MCF-7-TNR cells was assessed by counting live cells after 48 hrs in culture. A fold increase in the number of cells was obtained by calculating the ratios of the number of cells at 48 hrs post-seeding over the initial number of cells seeded. C) Total cell RNA was extracted from MCF-7 and MCF-7-TNR cells. The mRNA levels of SFN and the selected markers for the luminal-like subtype were compared between MCF-7 and MCF-7-TNR cells. A fold change of each transcript in MCF-7-TNR cells over that in MCF-7 cells was obtained by normalizing to the house keeping gene 36B4 and setting the values from MCF-7 cells to one. D) Similar to part C except that the mRNA levels of the selected markers for the basal-like subtype were compared between MCF-7 and MCF-7-TNR cells. E) Total cell lysates were extracted from MCF-7 and MCF-7-TNR cells. The protein levels of the indicated genes were measured using immunoblots. When presented, means and standard deviations were obtained from three independent experiments. *, **, and *** indicate a P value < 0.05, 0.01, 0.001, respectively.

