
Figure 2.
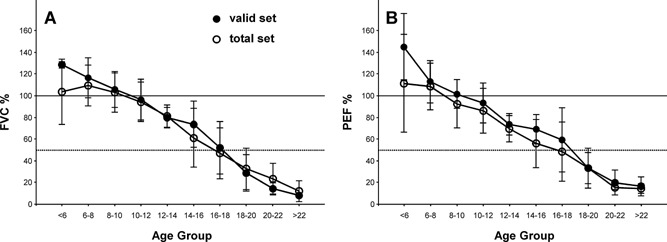
Comparison of all subjects' test results and the curated valid data set for percent predicted FVC and PEF. Data are mean ± SD. N = 2–12 per data point. For reference, the horizontal lines depict 100% (solid) and 50% (dotted) of predicted FVC and PEF.