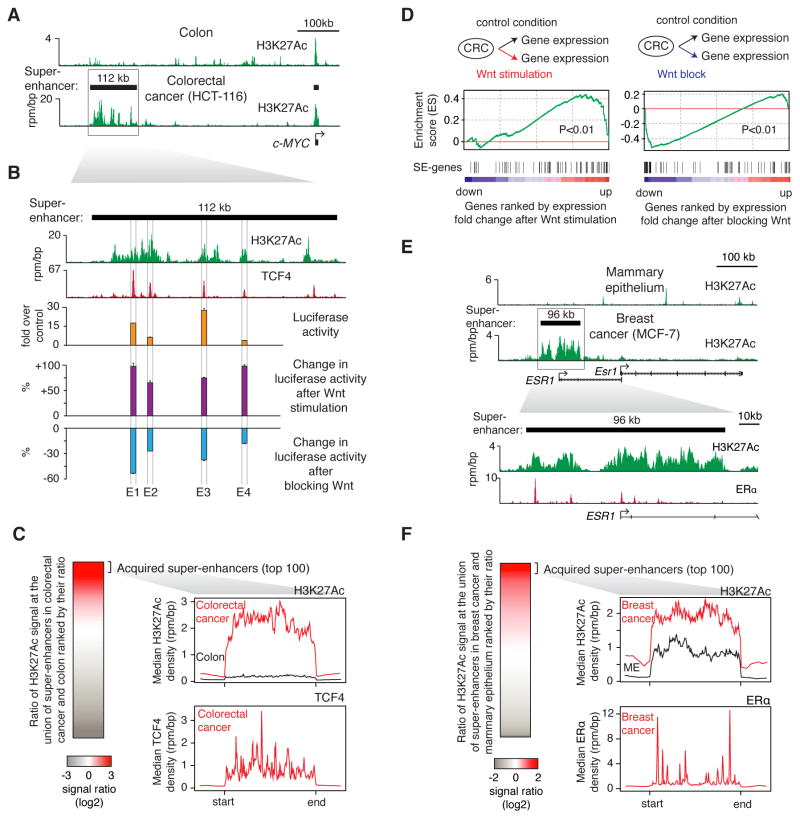
Figure 4. TCF4 occupancy and Wnt responsiveness of super-enhancers acquired in colorectal cancer.
(A) ChIP-Seq binding profiles for H3K27Ac at the c-MYC locus in colon and colorectal cancer cells (HCT-116). (B) A blow-up of the region indicated by a box on panel (A). TCF4 binding profile in the HCT-116 is displayed, along with the enhancer activity of TCF4-bound constituents of the acquired super-enhancer at MYC locus. Luciferase reporter activity in HCT-116 cells and the change in enhancer activity after Wnt stimulation or blockage are plotted. Values correspond to mean +SD from three biological replicate experiments. (C) (left) Ratio of H3K27Ac in CRC (HCT-116) vs. normal colon tissue used densities at the union of SEs identified in the two samples. (right) Metagene representation of H3K27Ac and TCF4 ChIP-Seq densities at the regions corresponding to the top 100 acquired super-enhancers. (D) Gene set enrichment analysis (GSEA) of gene expression changes after manipulation of the Wnt pathway. “SE-genes” indicate genes that are associated with acquired SEs. (E) (top) ChIP-Seq binding profiles for H3K27Ac at the ESR1 locus in mammary epithelium and breast cancer cells (MCF-7). (bottom) A blow-up of the region indicated on top. ChIP-Seq binding profile for ERα is displayed. (F) (left) Ratio of H3K27Ac in breast cancer (MCF-7) vs. mammary epithelium (ME) at the union of SEs identified in the two samples. (right) Metagene representation of H3K27Ac and ERα ChIP-Seq densities at the regions corresponding to the top 100 acquired super-enhancers.

