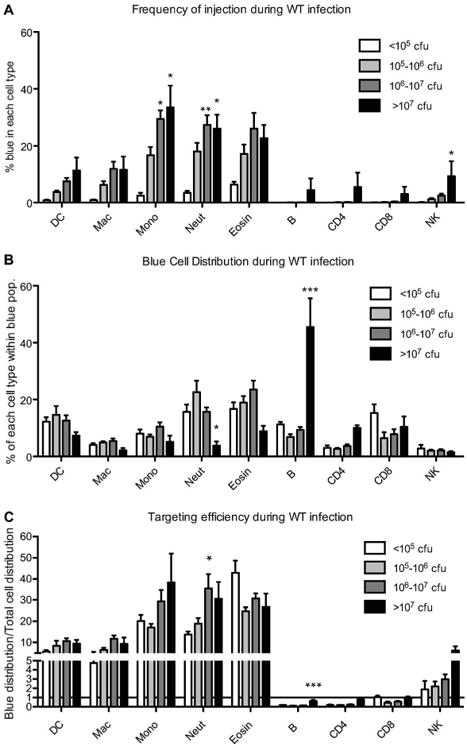
Figure 2. Target cell selection during infection with WT Y. pestis.

Mice described in Fig. 1 were infected with WT Y. pestis, and splenocytes were analyzed by flow cytometry (described in Fig. S1) to identify each cell type as well as blue injected cells. A) Frequency of injection: After cell types are identified from total live cells, the % of blue cells in each population was determined. B) Blue cell distribution: Blue cells were first identified from total live cells and then subjected to the myeloid and lymphoid analysis to identify cell types within the blue population. C) Targeting efficiency: The blue cell distribution was compared to the total cell distribution. The fold-difference for each cell type is the “targeting efficiency”, and these values are graphed here (horizontal line at Y=1 indicates no cell preference). Data were analyzed by 2-way ANOVA with Bonferroni multiple comparisons test to determine significant differences between the lowest cfu load compared to higher cfu loads for each cell type. (* P<0.05, ** P<0.01, *** P<0.001) DC= dendritic cells; Mac= macrophages; Mono= monocytes; Neut= neutrophils; Eosin= eosinophils; CD4= T helper cells; CD8= T cytotoxic cells; NK= NK cells.
