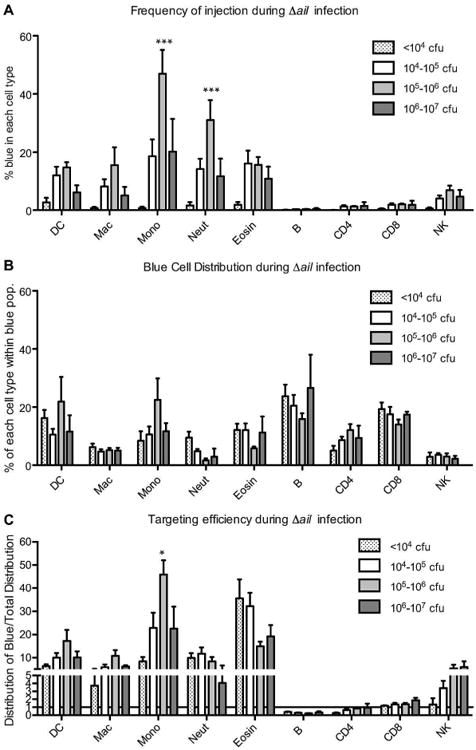
Figure 3. Target cell selection during infection with Δail Y. pestis.

Mice described in Fig. 1 were infected with Δail Y. pestis, and splenocytes were analyzed as described in Fig. S1. A) Frequency of injection. B) Blue cell distribution. C) Targeting efficiency. Data were analyzed by 2-way ANOVA with Bonferroni multiple comparisons test to determine significant differences between the lowest cfu load compared to higher cfu loads for each cell type. (* P<0.05, ** P<0.01, *** P<0.001) DC= dendritic cells; Mac= macrophages; Mono= monocytes; Neut= neutrophils; Eosin= eosinophils; CD4= T helper cells; CD8= T cytotoxic cells; NK= NK cells.
