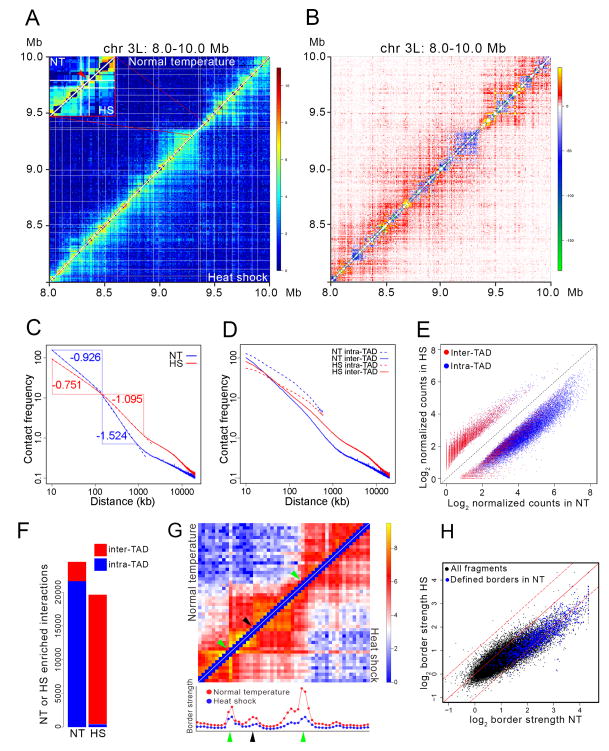
Figure 1. Changes in TAD organization after heat shock.
(A) Hi-C contact maps at single fragment resolution for control (upper left) and heat shock (lower right) Kc167 cells plotted with normalized intra-chromosomal arm read pairs in a 2 Mb region of chromosome 3L. White lines denote TAD borders in control cells. Inset shows an enlargement of a 34-HindIII fragment region of chromosome 3L containing several heat shock genes within a 16 kb interval; red arrow indicates the location of these genes.
(B) Subtraction of normal temperature control from heat shock contact matrices shows changes in contact frequencies between the two Hi-C samples. Region of chromosome 3L depicted is the same as in Figure 1A.
(C) Intra-chromosome arm chromatin contact frequency decay curves of control (NT, blue) and heat shock (HS, red) Hi-C data. Point of intersection between the vertical blue and horizontal red lines is located at 140 kb.
(D) Intra-chromosome arm chromatin contact frequency decay curves of control (NT, blue) and heat shock (HS, red) for intra- and inter-TAD interactions.
(E) Scatter plot of intra- and inter-TAD contact frequencies of control-specific (NT) and heat shock-specific (HS) interactions. Interactions were calculated based on counts present in 5 kb bins. Diagonal dashed black line shows the result assuming there is no difference in intra- or inter-TAD contacts between NT and HS.
(F) Number of intra- and inter-TAD interactions specific for the control (NT) and heat shock (HS) Hi-C data sets.
(G) Contact matrices of a ~200 kb region from cells grown at normal temperature (upper left) or heat shocked (lower right) at single fragment resolution. Green arrows indicate the location of TAD borders determined computationally. Black arrow indicates the location of a sub-TAD border determined visually. Graphs below the heat maps indicate the border strength for each restriction fragment shown in the heat maps above. Red and blue dots indicate border strength in arbitrary units in control and heat shocked cells, respectively.
(H) Scatter plot comparing TAD border strength in control (NT) and heat shock (HS) Hi-C samples. Blue dots indicate border strength for TAD borders determined using a probability-based model. Black dots indicate border strength for all HindIII restriction fragments in the genome. Dashed lines above and below the diagonal indicate + or − one standard deviation, respectively.
See also Figure S1.

