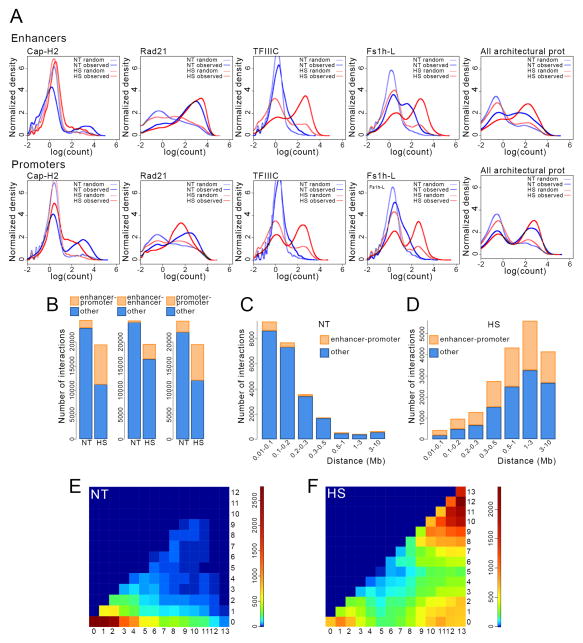
Figure 4. Changes in enhancer-promoter interactions in heat shocked cells.
(A) Relationship between the number of sites and the ChIP-seq read count for various architectural proteins in control and heat shocked cells at enhancers and promoters.
(B) Changes in the number of interactions among enhancers and promoters in heat shocked (HS) with respect to control (NT) cells.
(C) Number of interactions at different distances for enhancer-promoter contacts in cells grown at normal temperature (NT).
(D) Number of interactions at different distances for enhancer-promoter contacts in heat shocked cells (HS).
(E) Frequency of interactions between enhancers and promoters containing different numbers (1–13) of architectural proteins in cells grown at normal temperature (NT).
(F) Frequency of interactions between enhancers and promoters containing different numbers (1–13) of architectural proteins in cells subjected to temperature stress (HS).
See also Figure S2.

