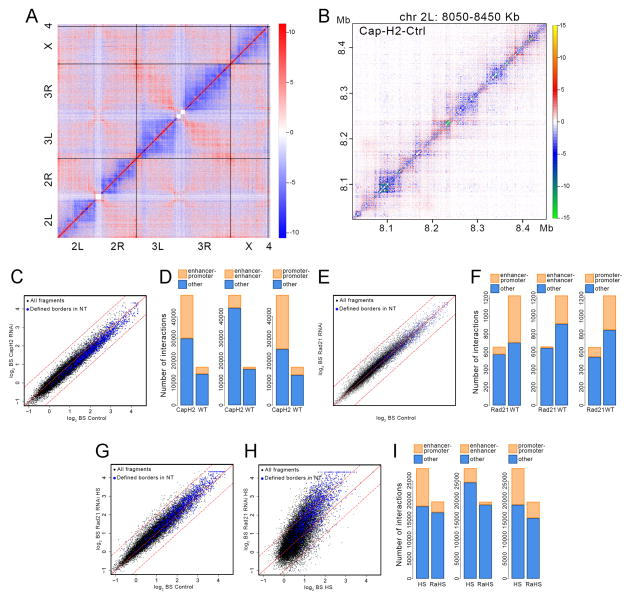
Figure 5. Effect of Cap-H2 and Rad21 depletion on 3D chromatin organization.
(A) Whole genome heat map obtained by subtracting the two dimensional contact matrix of Hi-C data from control cells from that of Cap-H2 depleted cells. Black vertical and horizontal lines indicate chromosome boundaries.
(B) Heat map for a 400 kb region of chromosome 2L obtained by subtracting the two dimensional contact matrix of Hi-C data from control cells from that of Cap-H2 depleted cells.
(C) Scatter plot comparing border strength (BS) in Hi-C samples from control and Cap-H2 depleted cells. Blue dots indicate TAD borders determined using a probability-based model. Black dots indicate all DpnII restriction fragments in the genome. Dashed lines above and below the diagonal indicate + or − one standard deviation, respectively.
(D) Number of interactions among enhancers and promoters specific for normal (WT) and Cap-H2-depleted (CapH2) cells.
(E) Scatter plot comparing border strength (BS) in Hi-C samples from control and Rad21 depleted cells. Symbols are as in panel C.
(F) Number of interactions among enhancers and promoters specific for normal (WT) and Rad21-depleted (Rad21) cells.
(G) Scatter plot comparing border strength in Hi-C samples from control and Rad21 depleted cells subjected to heat shock. Symbols are as in panel C.
(H) Scatter plot comparing border strength in Hi-C samples from normal control and Rad21 depleted cells, both subjected to heat shock. Symbols are as in panel C.
(I) Number of interactions among enhancers and promoters specific for heat shocked (HS) and Rad21-depleted cells subjected to heat shock (RaHS).
See also Figure S3.

