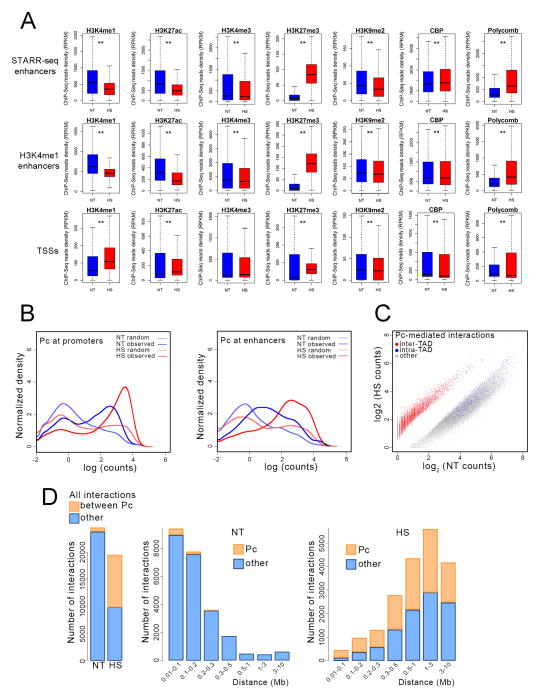
Figure 6. Changes in histone modifications and chromatin proteins in heat shocked cells.
(A) Box plots indicating changes in the levels of various histone modifications and chromatin proteins at enhancers and promoters of control (blue) versus heat shocked (red) cells. ** indicates p<0.001
(B) Changes in the number of Pc sites at enhancers and promoters and the read number at each site in control (NT) versus heat shocked (HS) cells.
(C) Scatter plot showing changes in intra- and inter-TAD interactions between DNA fragments containing Pc in control (NT) versus heat shocked (HS) cells.
(D) Changes in the number of interactions and the distance between the interacting Pc-containing DNA fragments in control (NT) versus heat shocked (HS) cells.
See also Figure S4

