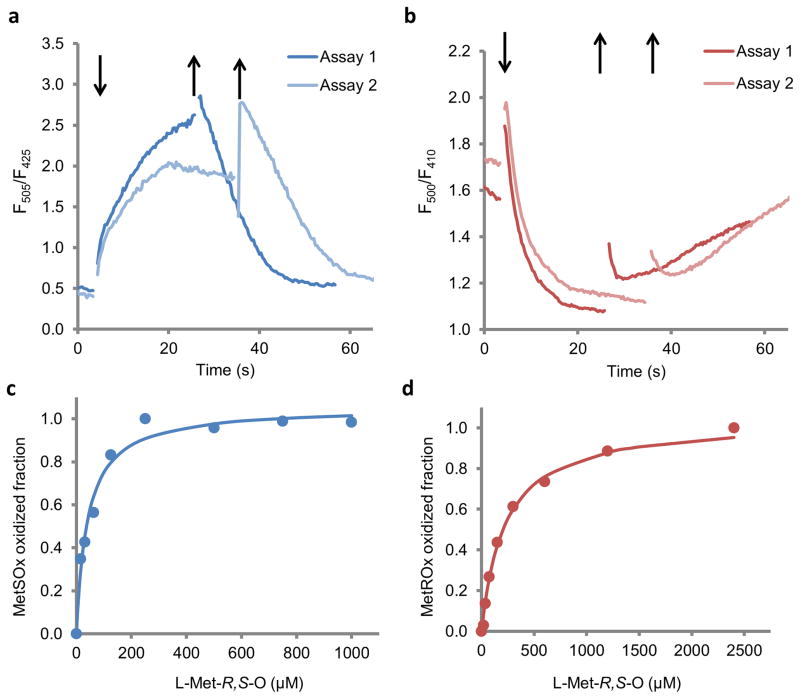
Figure 3. Characterization of MetSOx and MetROx sensors in E. coli.
E. coli cells expressing MetSOx (a) or MetROx (b) were incubated with MetO for ~30 min, and then rinsed to remove the oxidant. Arrows indicate the addition (↓) of MetO and rinsing (↑) the cells for two representative experiments (Assay 1 and Assay 2). MetSOx (c) and MetROx (d) oxidized fractions calculated from Supplementary Fig. 9 (n = 3), using equations 1 and 2, respectively, described in the “online methods” section.

