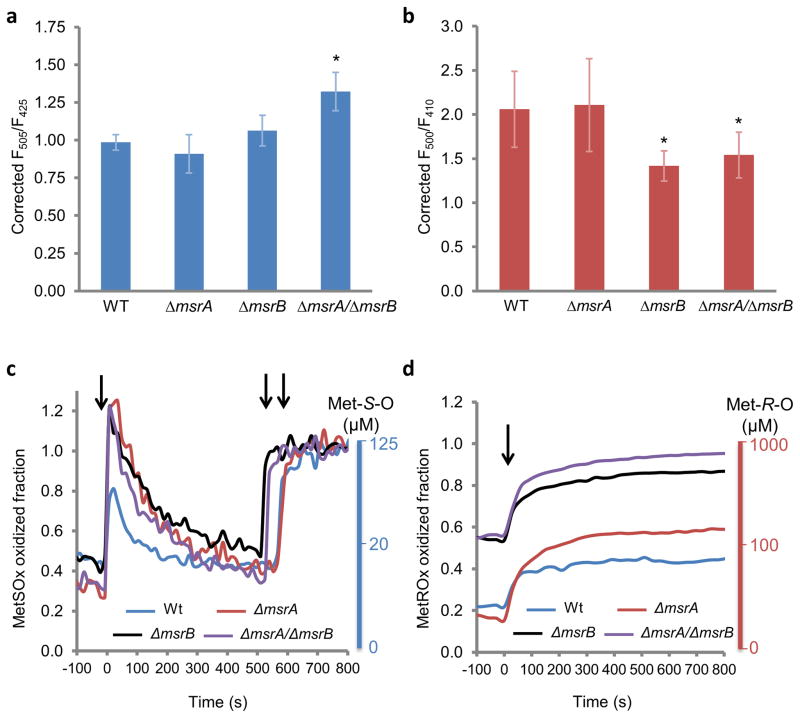
Figure 4. MetSOx and MetROx oxidation levels and the response to sodium hypochlorite in E. coli.
Static measurements of fluorescence in Wt and msr mutants expressing MetSOx (a) or MetROx (b). Strains were grown in LB for 20 h, rinsed and equilibrated in M9 medium and the ratio of fluorescence was recorded for cells expressing the sensor or its inactive form. The ratio was corrected by dividing the inactive sensor values. The values are presented as mean (n = 3) ± SD and are representative of 3 replicates. *p<0.05 (Student’s t-test) compared to Wt. Dynamics of the intracellular response of Wt and msr mutants expressing MetSOx (c) or MetROx (d) to NaOCl. Strains were grown in LB for 20 h, washed and equilibrated in M9 medium prior to the addition of NaOCl. The ratio of fluorescence was recorded for cells expressing the sensor or its inactive form, and was corrected by dividing the values of the inactive sensor. The fraction oxidized was calculated using equations 1 and 2 (online methods). MetS-O and Met-R-O scales were determined empirically from Fig. 3a, b. In panel c, the first arrow indicates the addition of NaOCl, and second and third arrows indicate the addition of free MetO. In panel d, the arrow indicates the addition of NaOCl. The data presented are representative of 3 replicates. Representative kinetics obtained for both MetO sensors and their inactive forms are shown in Supplementary Fig. 11.

