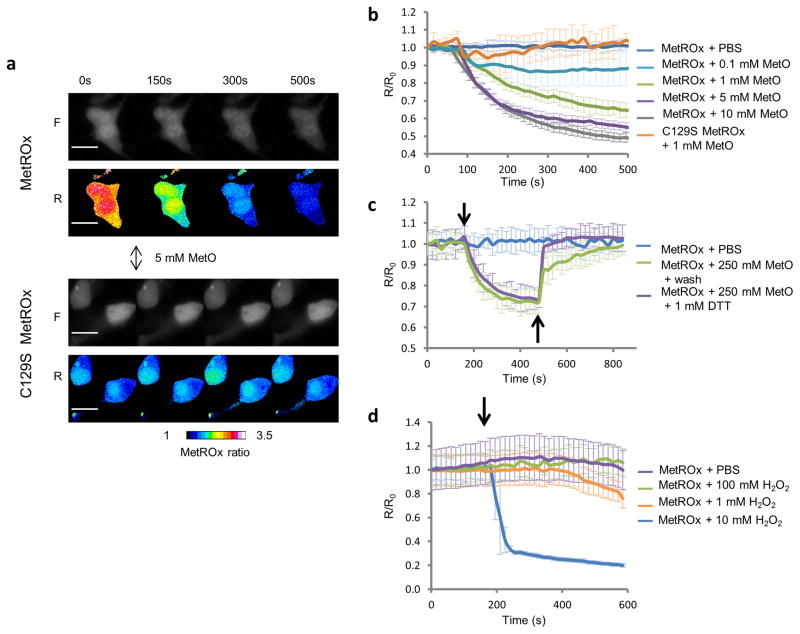
Figure 5. Characterization of MetROx in HEK293 cells.
(a) Time-series of raw fluorescent (F) and pseudocolored (R) ratio images of MetROx- and C129S MetROx-expressing cells subjected to 5 mM MetO. Scale bars represent 20 μm. (b) Kinetics of MetROx fluorescence in cells subjected to MetO (0.1 – 10 mM) detected by single cell live-microscopy. Background was subtracted and fluorescence ratios were normalized by the value at t = 0 s (n = 6–28). (c) Kinetics of fluorescence changes in MetROx-expressing cells treated with 250 μM MetO (↓), followed by washing or 1 mM DTT treatment (↑). (d) MetROx response to H2O2 in HEK293 cells. Time course analysis of HEK293 cells expressing MetROx and subjected to the indicated concentrations of H2O2. The fluorescence ratios were normalized by the value at t = 0 s. Data presented are the means (n = 6–8) ± SD and are representative of 3 replicates.

