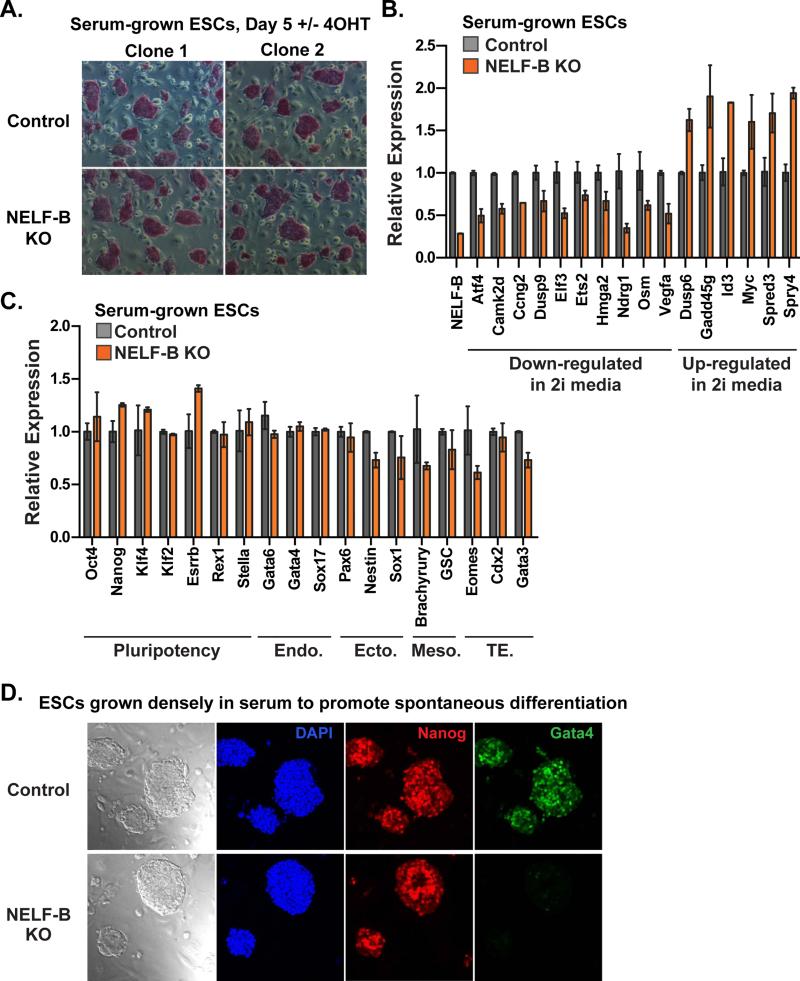
Figure 5. Ablation of NELF-B Renders ESCs Resistant to Differentiation in Serum.
(A) Alkaline phosphatase staining of Control and NELF-B KO ESCs grown in serum on feeders (Day 5 after treatment +/− 4OHT). NELF-B KO ESCs display similar colony morphology and size, as well as equal staining intensity with alkaline phosphatase.
(B) Quantitative RT-PCR analysis of mRNA in NELF-B KO ESCs grown in serum on feeders. Genes involved in proliferation and FGF/ERK signaling were similarly dysregulated in serum-exposed NELF-B KO ESCs as compared to ESCs grown in 2i.
(C) Pluripotency marker expression is similar between Control and NELF-B KO ESCs, while lineage-specific genes are unchanged, or even down-regulated in NELF-B KO cells grown in serum conditions. Markers represent: endoderm (Endo.), ectoderm (Ecto.), mesoderm (Meso.) and trophectoderm (TE) lineages. Values shown represent N=2 independent clones ± range, with control levels set as 1.
(D) Bright field images depict typical differences in morphology between Control and NELF-B KO ESCs grown to high density in serum on feeders to induce spontaneous differentiation (Day 5 after treatment +/− 4OHT). Immunofluorescence is shown for DAPI, Nanog, and Gata4. Representative images are merged z-stack sections, to show the absence of Gata4 within the entire field of view.
See also Figure S5.

