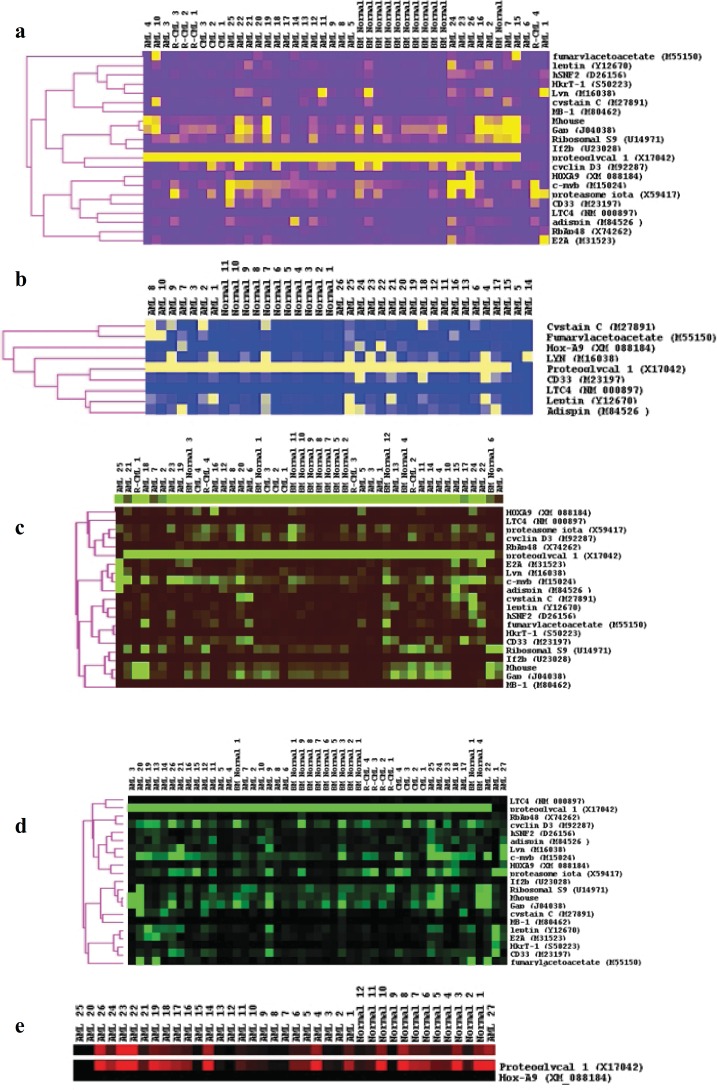
Figure 8.
Unsupervised cluster analyses for, (a) all diagnostic groups for all genes in the total BM fraction, (b) all diagnostic groups for all genes in the CD34+ve fraction, (c) all diagnostic groups for all genes in the CD34-ve fraction, (d) AML and normal BM samples in the space of the genes upregulated in AML (from Golub et al, 1999), in the total BM fraction and (e) AML and normal BM samples in the space of proteoglycan 1 and HOXA9 in the CD34-ve fraction only. The normalised gene expression values for each sample were processed using the Cluster and TreeView software available from the Eisen laboratory (http://rana.lbl.gov/eisensoftware.htm).

