Figure 7.
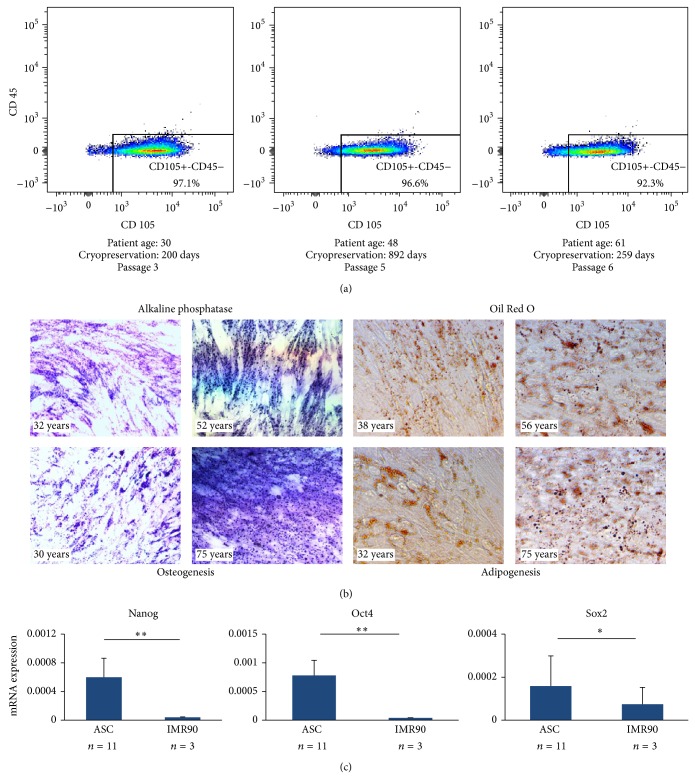
ASC phenotype confirmation. (a) ASCs were analyzed via FACS analysis for the following markers: CD105, CD34, and CD45. The data from representative patient cohorts are shown here. As predicted, the great majority of ASCs were CD105+ and CD45−, while the CD34 marker showed variable expression (data not shown), consistent with prior studies. (b) ASCs isolated from all subgroups were capable of undergoing both osteogenic and adipogenic differentiation, as demonstrated by positive staining with alkaline phosphatase and Oil Red O, respectively. (c) Pluripotency gene expression was measured via qRT-PCR for Nanog, Sox2, and Oct4 and, as expected, was found to be higher in ASCs compared to terminally differentiated IMR90 cells. ∗ P < 0.05 and ∗∗ P < 0.01.

