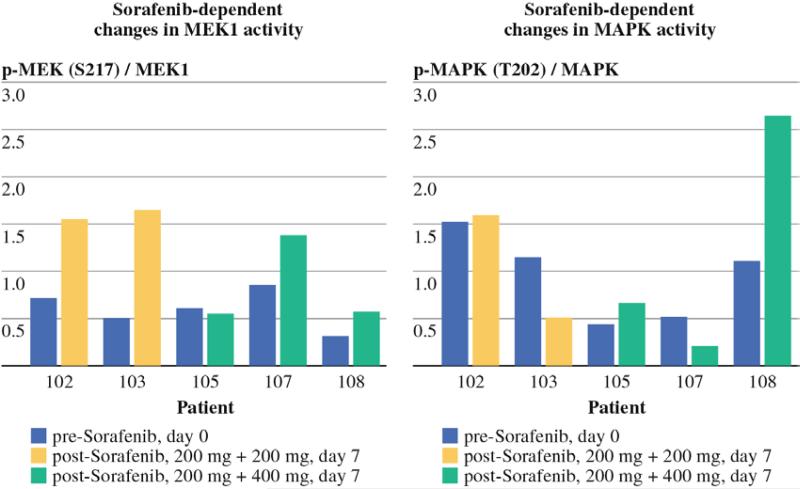
Figure 4.
Reverse phase protein array (RPPA) analysis. Using linear load-corrected measurements of protein expression, the ratio of phospho-protein to total protein is plotted for 5 patients before and after treatment with sorafenib for MEK (left) and MAPK (right). Tumor tissue was analyzed from two patients from the low-dose (400 mg) sorafenib cohort and 3 patients from the high-dose (600 mg) sorafenib cohort.

