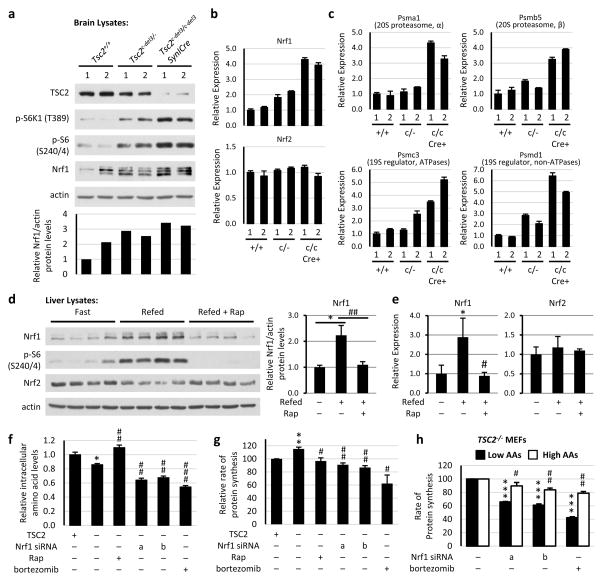
Figure 4. NRF1 is induced upon mTORC1 activation in tissues and influences cellular amino acid levels and protein synthesis.
a, Protein from indicated brain lysates are shown, with NRF1 levels normalized to actin below. b, Nrf1 and Nrf2 and c, PSM gene transcript levels from brain tissues in a are shown as mean ± s.e.m. of triplicate samples relative to Tsc2+/+ sample 1. d, Mice fasted overnight were refed (6 h) following 30-min pretreatment with vehicle or rapamycin (10 mg/kg). Protein from liver lysates are shown, with NRF1 levels normalized to actin graphed as mean ± s.e.m. relative to fasted mice (n=4 per condition). *P<0.05, ##P<0.01. e, Transcript levels from liver tissues in d are shown as mean ± s.e.m. relative to fasted mice. *P<0.05, #P<0.05. f, Tsc2−/− MEFs expressing TSC2 or empty vector transfected with Nrf1 (a and b) or control siRNAs were serum starved 16 h with vehicle or 20 nM rapamycin or treated 1 h with 100 nM bortezomib. Amino acid levels are shown as mean ± s.e.m. of triplicate samples relative to TSC2-expressing cells. *P<0.05 compared to TSC2-expressing cells, ##P<0.01 or ###P<0.001 compared to vehicle-treated vector-expressing cells. g, Rates of protein synthesis in cells treated as in f are shown as mean ± s.e.m relative to TSC2-expressing cells (n=3). **P<0.01 compared to TSC2-expressing cells; #P<0.05 or ##P<0.01 compared to vehicle-treated vector-expressing cells. h, Cells treated as in f were switched to low or high amino acid media overnight, and rates of protein synthesis are shown as the mean ± s.e.m relative to vehicle-treated cells (n=3). ***P<0.001 compared to vehicle-treated low AA cells; #P<0.05 or ##P<0.01 compared to vehicle-treated high AA cells. d–h, Statistical significance for pairwise comparisons evaluated with a two-tailed Student’s t test.

