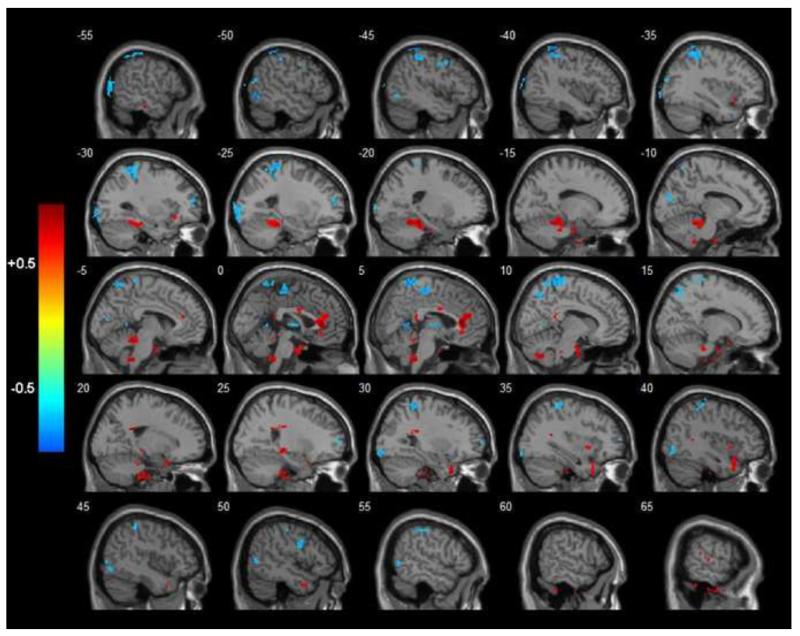
Figure 2.
R-statistical maps illustrating correlation between LF-fALFF and CES-D values in depressed subjects. Significant clusters of bigger than 304 mm3 were shown after correction for multiple comparison (p < 0.05). The color bar on the left side refers to the range of R values. Hotter and colder colors display positive and negative correlations respectively.

