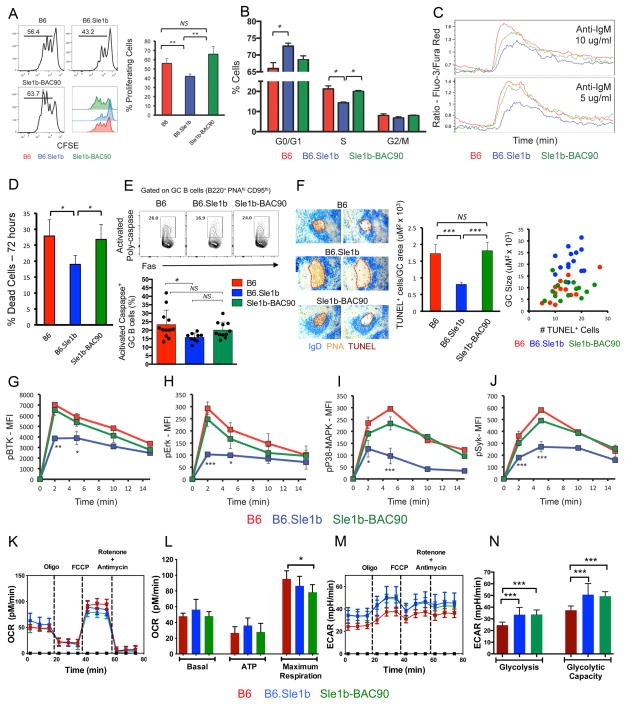
Figure 6. Analysis of B cell proliferation, apoptosis, signaling, and cellular metabolism.
(A-left panel) In vitro proliferation of CFSE-labeled B cells stimulated with anti-IgM and anti-CD40. (A-right panel) Bar graphs display the percentages of proliferating B cells. (B) Cell cycle analysis of purified B cells after anti-IgM and anti-CD40 stimulation by PI staining. (C) Calcium flux of B cells after anti-IgM stimulation. (D) Bar graphs show the percentage of dead cells after anti-IgM and anti-CD40 stimulation. (E) Top panel, Contour plots show representative gating strategy for GC B cells stained ex-vivo with SR-VAD-FMK, a polycaspase probe. Lower panel, Bar graph shows the percentage of GC B cells positive for activated poly-caspases in the indicated strains. Each circle represents an individual mouse. Error bars show mean with SD. (F) Left panel, consecutive spleen sections were stained for IgD (blue), PNA (red), and TUNEL (brown). Data is representative of 5 mice per group. Middle panel shows bar graphs depicting the ratio of TUNEL+ cells and GC size (uM2 × 103). Right panel shows correlation between the number of TUNEL+ cells and the GC size. (G–J) Flow cytometric analysis to evaluate the kinetics of phosphorylation of BtK, Erk, p38/MAPK, and Syk after anti-IgM stimulation of B cells. (K and M) Representative plots show the measurement of OCR and ECAR, respectively, in B6, B6.Sle1b and Sle1b-BAC90 B cells stimulated with anti-IgM and anti-CD40 for 18h. (L) Histograms show the average basal oxygen consumption; ATP production through ATP synthase and the maximal electron transport capacity of activated B cells from 3–4 mice per indicated group. (N) Histograms depict average ECAR values for glycolysis and the glycolytic capacity of activated B cells from 3–4 mice per strain. * p =≤0.05, ** p =≤0.01, *** p =≤0.001.

