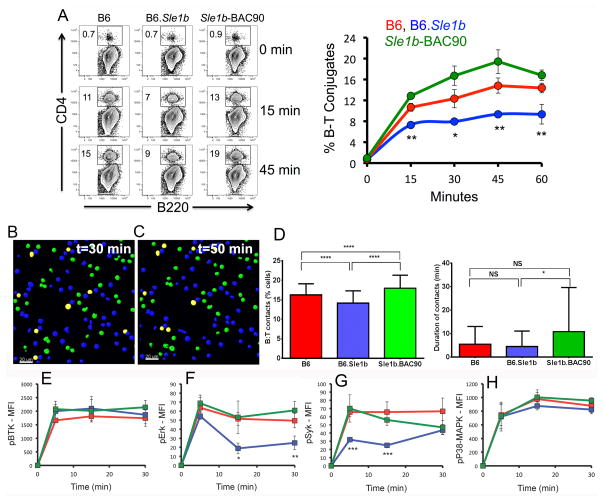
Figure 7. Reduced B cell-T cell conjugate formation in B6.Sle1b mice.
(A) Representative flow cytometry plots of B220+ B cell and CD4+ OT-II T cell conjugate formation. Conjugate formation was calculated as B220+CD4+ double positive for each indicated mouse group over the course of 60 minutes. Kinetics of B–T conjugate formation is depicted in the graph on the right (A). (B–C) Representative 2D confocal images of B6 B cells (blue) and OT-II T cells (green) in co-culture at 30 min and 50 min, respectively. The B and T cells in contact with each other are shown in yellow. (D) Averaged percentage (left panel) and duration (right panel) of contacts between OT-II T cells and B cells from indicated strains over a period of 60 min. The analysis was performed twice, with B cells pooled from 2–3 mice per group. (E–H) Kinetics of phosphorylation of BtK, Erk, p38/MAPK, and Syk in B cells during conjugate formation with T cells over the course of 30 minutes. *p <0.05, **p <0.01, ***p <0.001.

