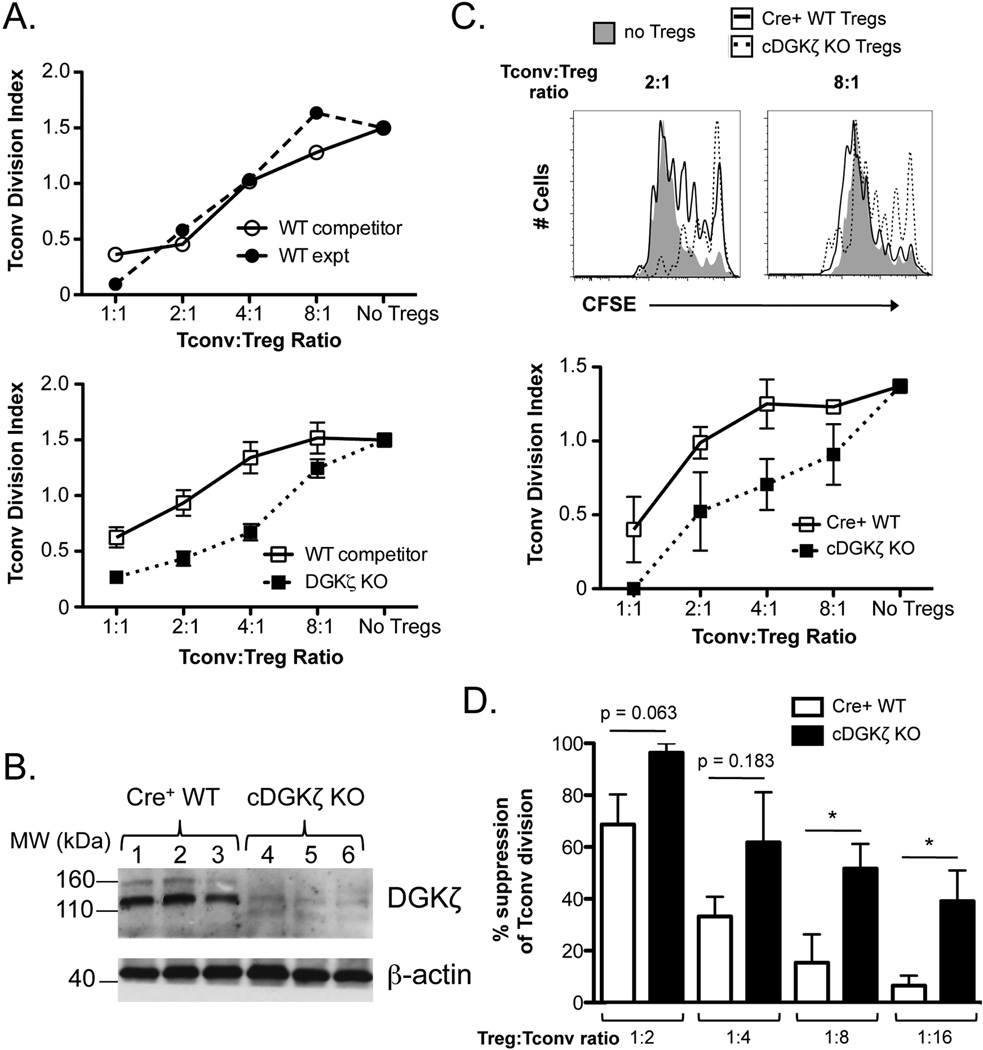
Figure 3. DGKζ KO Tregs exhibit enhanced suppressive capacity.
(A) CD4+CD25+ Tregs were sorted from WT/WT or WT/DGKζ KO mixed BM chimeras. WT competitor Tregs (CD45.1+/CD45.2+) or experimental Tregs (CD45.2+; WT or DGKζ KO) were cultured with CFSE-labeled Tconvs for four days in the presence of irradiated T cell-depleted splenocytes and anti-CD3. The division index of Tconvs at various Treg:Tconv ratios is shown for cells sorted from WT/WT (top) and WT/DGKζ KO mixed BM chimeras (bottom). The data are represented as mean ± SEM of n = 3 mixed BM chimeras. One representative of 2 independent experiments is shown. (B) FACS-sorted YFP+CD4+ T cells from Tamoxifen-treated T2-Cre+ WT (lanes 1–3) or cDGKζ KO mice (lanes 4–6) were FACS-sorted, lysed, and analyzed for expression for DGKζ and β-actin by Western blot analysis. (C) YFP+CD4+CD25+ Tregs from Tamoxifen-treated T2-Cre+ WT and cDGKζ KO mice were co-cultured with CFSE-labeled Tconvs for four days in the presence of irradiated T cell-depleted splenocytes and anti-CD3. Representative CFSE plots from four-day cultures lacking Tregs or at a 2:1 or 8:1 Tconv:Treg ratio of either Cre+ WT or cDGKζ KO Tregs (top) and a plot of the division index of Tconvs at various Tconv:Treg ratios are shown (bottom). The data are represented as mean ± SEM of n = 3 separate mice (bottom). One representative of 2 independent experiments is shown. (D) The division index of Tconvs at various Tconv:Treg ratios were normalized to the baseline Tconv division (no Tregs) for each experiment (n = 2 experiments) and represented as mean % suppression ± SEM (n = 4 mice total). * indicates statistical significance of p<0.05 by unpaired two-tailed Student t-test.

