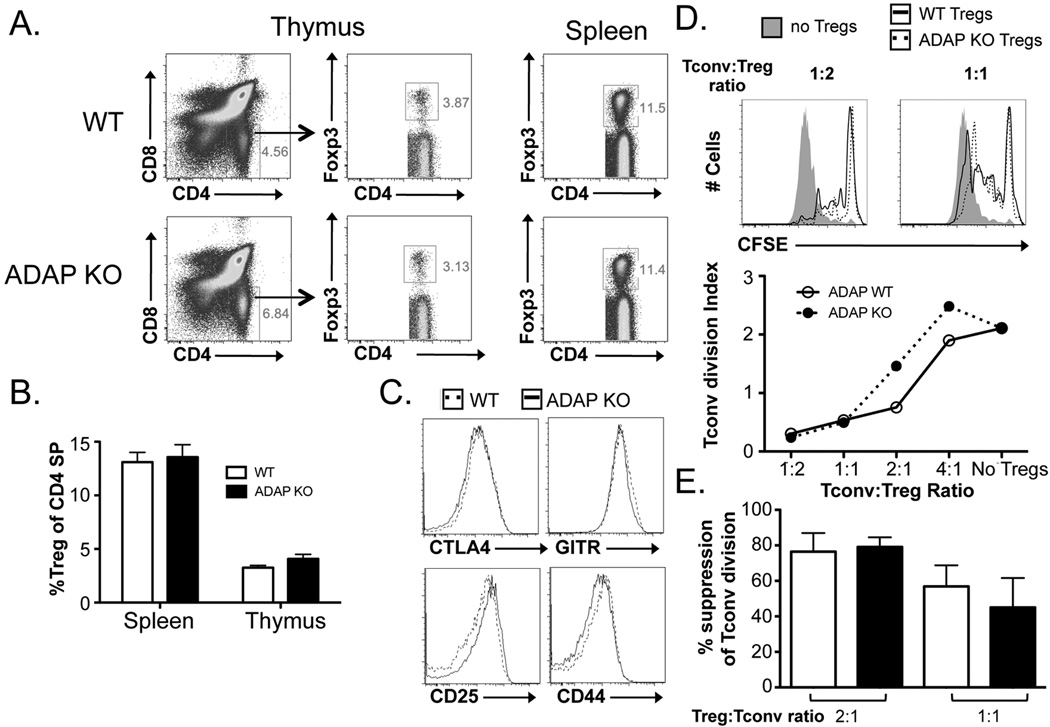
Figure 4. ADAP KO mice harbor Tregs with normal development and suppressive function.
(A) Representative flow cytometric plots and (B) the fraction of Tregs (out of CD4+ T cells) from the thymus and spleen of WT and ADAP KO Tregs are shown. (C) The expression of CTLA-4, CD25, GITR, and CD44 on Tregs from WT and ADAP KO Tregs is shown. (D) CFSE-labeled splenic CD4+Foxp3− Tconvs were cultured with either WT or ADAP KO Tregs for four days in the presence of irradiated T cell-depleted splenocytes and anti-CD3. Representative CFSE plots from four-day cultures lacking Tregs or containing a 1:2 or 1:1 Tconv to Treg ratio of either WT or ADAP KO Tregs are shown (top). A plot of the division index of Tconvs at various Treg:Tconv ratios are shown (middle). (E) The division index of Tconvs at Tconv:Treg ratios of 1:2 and 1:1 were normalized to the baseline Tconv division (no Tregs) for each experiment and represented as mean % suppression ± SEM (n = 3 mice total).

