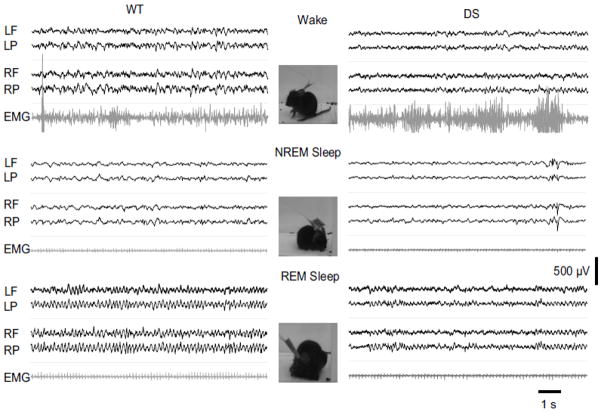
Fig. 2.
Less defined sleep EEG waveforms in DS mice than WT mice. Examples of wake, NREM sleep, and REM sleep EEG-EMG from WT (Left) and DS (Right) mice illustrating the less prominent and less sustained EEG delta waves during NREM sleep in a DS mouse, and the similarly less defined EEG theta waves during REM sleep of the same mouse. The stereotypic mouse behaviors for the EEG traces are characterized by activity in the associated EMG traces and depicted in adjacent photographs extracted from videos of experiments with the WT mouse. EEG trace labels correspond to electrode positions in Fig. 1B.

