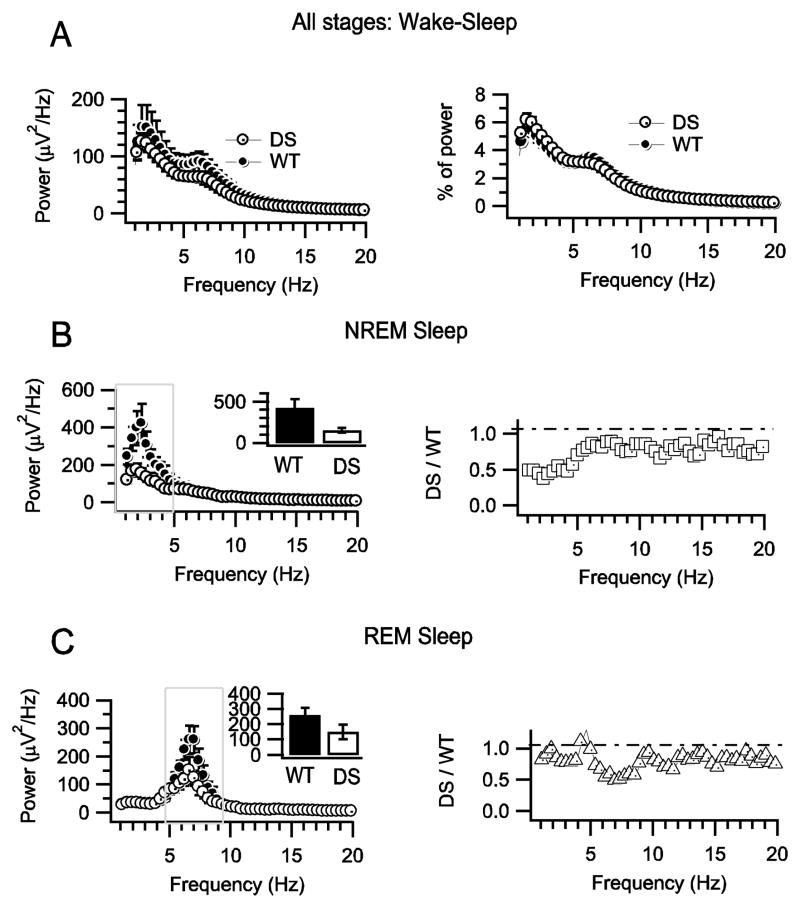
Fig. 3.
Decreased EEG power densities in DS mice during sleep. A, Unaltered mean power density profiles for combined wake and sleep states for WT and DS mice. B, Mean NREM sleep power density profiles and power ratios for DS and WT mice. (Left) Power density spectra for DS and WT mice. Inset shows mean ± s.e.m. of the integral of power in the delta frequency range. (Right) Ratio of DS/WT power density versus frequency. C, Mean REM sleep power density profiles and power ratios for DS and WT mice. (Left) Mean REM sleep power density profiles for DS and WT mice. (Right) Ratios of HET/WT power density in the theta frequency range.

