
Fig. 9.
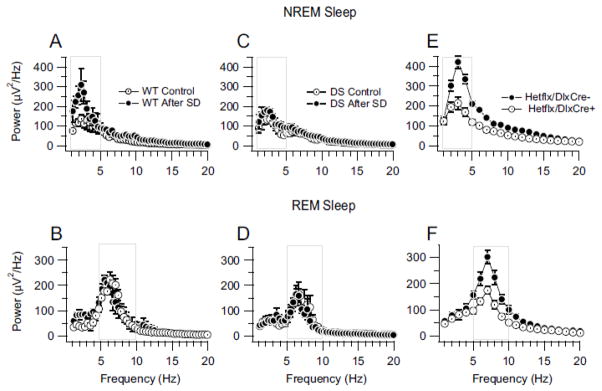
Reduced EEG power density during rebound from sleep deprivation in DS mice. A, Power density spectra for NREM sleep in WT mice after 5-h normal sleep (Control) and after 5-h sleep deprivation (SD). B, Power density spectra for REM sleep in DS mice after 5 h normal sleep (Control) and after 5-h sleep deprivation (SD). Boxes in A and B indicate the delta and theta frequency bands respectively. C, Rebound REM sleep EEG activity for DS mice after 5h of normal sleep (Control) and after 5h of sleep deprivation (SD). D, Rebound REM sleep EEG activity for DS mice after 5 h of sleep deprivation (SD). Boxes in C and D indicate the delta and theta frequency bands respectively. The power density measured under control conditions in these experiments is less than observed in Fig. 3 because here we recorded EEG for 3 h, beginning 5 h after the onset of the light period for homeostatic sleep regulation, whereas we recorded EEGs during 8 h of sleep from the onset of the light period for sleep architecture studies (See Materials and Methods). E and F, Decreased mean NREM (E) and REM (F) sleep EEG power density in conditional forebrain interneuron specific Scn1a KO mice. Boxes in E and F indicate the delta and theta frequency bands respectively