Figure 8.
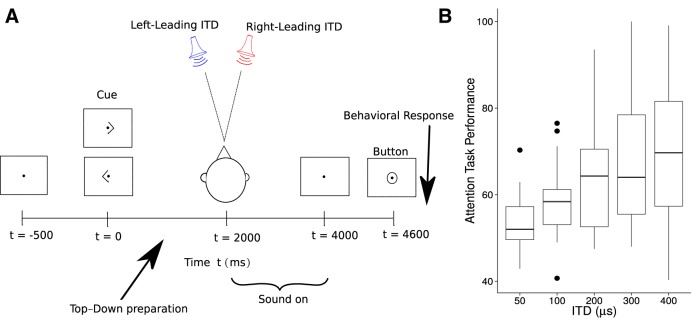
ITD-based attention. A, A schematic illustration of the sequence of events constituting the task. Each trial began with the subject visually fixated on the center of the screen. A visual cue (left or right arrow) appeared 2 s before the onset of the sounds, identifying the direction of the target stream (left or right, based on ITDs). Two simultaneous sequences of digits spoken by the same speaker and monotonized to the same pitch were then presented. Following the digit sequences, a visual response circle cued the subject to respond and indicate the three digits in the target sequence using button presses. Finally, feedback was given to the subject as follows: a green circle, indicating that all three digits were identified correctly; a blue circle, indicating that two of the three digits were identified correctly; or a red cross, indicating that fewer than two response digits matched the correct target sequence. B, Performance as a function of ITD. Large individual differences are evident. The upper and lower hinges correspond to the first and third quartiles (the 25th and 75th percentiles). The upper whisker extends from the hinge to the highest value that is within 1.5 * IQR of the hinge, where IQR is the inter-quartile range, or distance between the first and third quartiles. The lower whisker extends from the hinge to the lowest value within 1.5 * IQR of the hinge. Data beyond the end of the whiskers are outliers and plotted as individual points. The drop in performance with ITD indicates that sensory coding limitations, perhaps related to source separability, dominate performance.

