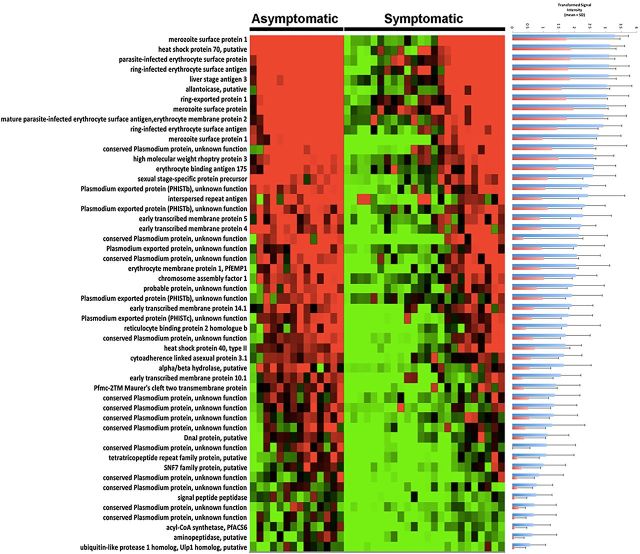
Figure 2.
Plasmodium falciparum antigens found to be differently reactive between asymptomatic and symptomatic subjects. Red, highest signal intensity; green, lowest signal intensity. At right, variance-transformed values for asymptomatic subjects (blue bars) and symptomatic subjects (red bars), showing quantitatively different signal intensities. Gene identifications are specified in the same order as in Table 2. The heat map was made using MultiExperiment Viewer (MEV) 4.8.

