
Figure 1.
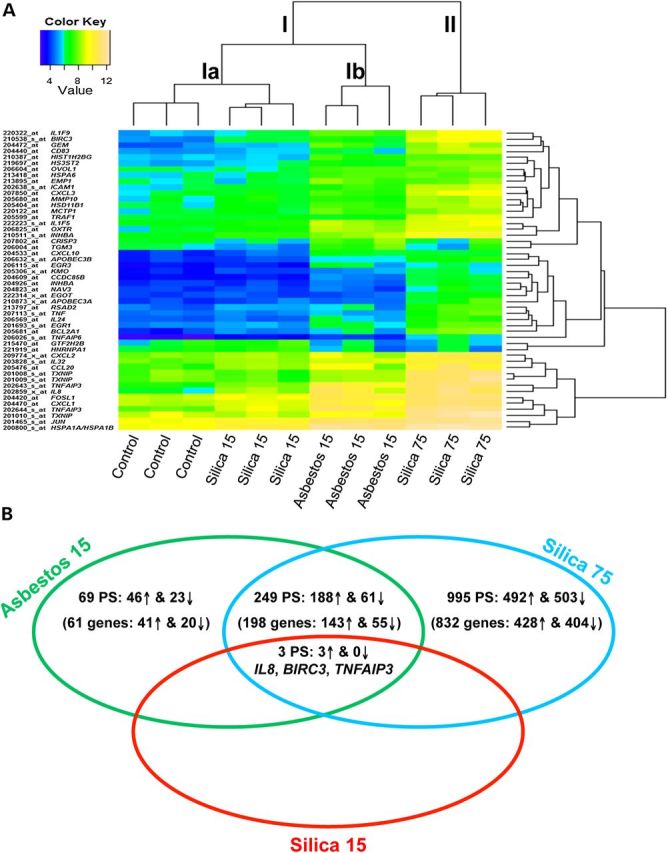
Unsupervised hierarchical cluster analysis and overall gene changes in mineral exposed NHBE cells. (A) Unsupervised hierarchical cluster analysis of gene expression profiles of unexposed control NHBE cells and cells exposed to crocidolite asbestos 15 × 106 µm2/cm2 (asbestos 15), cristobalite silica 15 × 106 µm2/cm2 (silica 15) or 75 × 106 µm2/cm2 (silica 75) (n = 3 samples/group) based on the log2 expression values of the top 50 most variable probe-sets. Individual samples are shown in columns and genes in rows. The log2 expression values for individual genes are indicated by color (yellow indicates a high and blue a low level of expression). (B) Venn diagram representation of the total number of probe-sets and genes (up-regulated and down-regulated) significantly altered by all three exposure groups compared. This includes those specific to each exposure as well as those commonly affected by different exposures [≥1.5-fold versus controls; adj. P < 0.05 (FDR < 0.05)].