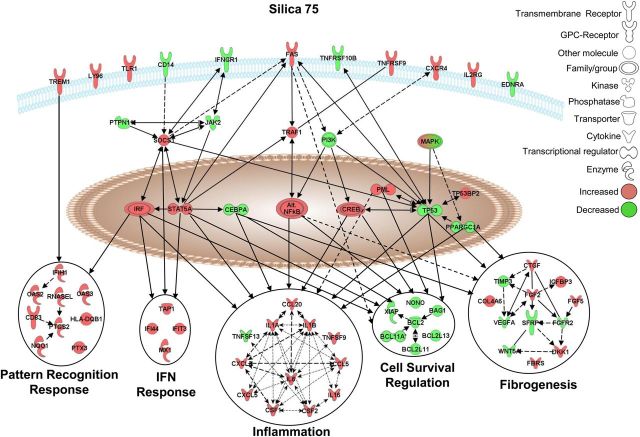
Figure 7.
Pathways selectively affected by crystalline silica in NHBE cells. Graphical representation of the experimentally confirmed relationships between genes distinctively altered in expression by silica (75 × 106 µm2/cm2) using IPA software. Red and green colors indicate up- or down-regulation of gene expression levels, respectively, compared with unexposed control cells [≥1.5-fold versus controls; adj. P < 0.05 (FDR < 0.05)]. All gene names, fold-change values, and adj. p-values are listed in Supplementary Material, Table S6.

