Figure 3.

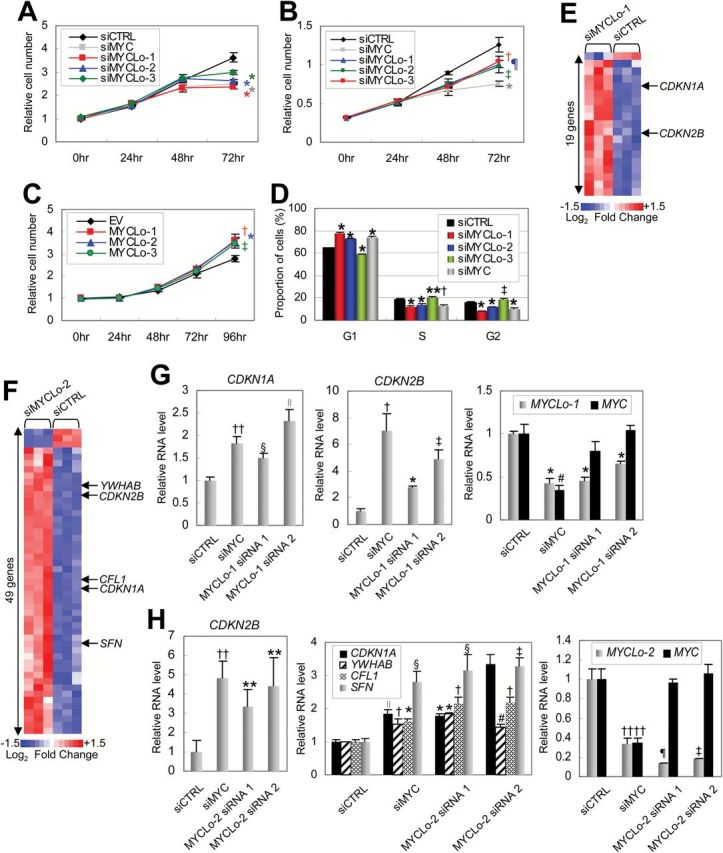
Effect of MYCLos knockdown on cell proliferation and cell cycle progression. A and B) Cell proliferation assays. HCT116 (n = 5, A) or PC3 (n = 4, B) cells were treated with siRNAs (final concentration: 50nM), as indicated and subjected to proliferation assay every 24 hours (†P = .013; ‡P = .0048; ¶P = .009; *P < .001). Error bars represent standard deviation. C) Cell proliferation assay. CCD-18Co cells were transfected with pcDNA3.3 plasmids (EV) expressing MYCLo-1, -2, or -3 and subjected to a cell proliferation assay every 24 hours (n = 3) (*P = .001; †P = .0045; ‡P = .0025). Error bars represent standard deviation. D) Proportion of cells in each cell cycle phase determined by flow cytometry analysis. HCT116 cells were treated with siRNAs (50nM) as indicated and analyzed 48 hours after transfection. Data are mean ± SD of three independent experiments and each measured in triplicate (**P = .047; †P = .0085; ‡P = .00662; *P < .001). E) Heatmap representing cell cycle regulator genes dysregulated by MYCLo-1. The genes that are commonly regulated by MYC are indicated. Expression values displayed in gradient of red and blue are Log2-transformed fold change. The list of the dysregulated genes is available in Supplementary Table 4 (available online). F) Heatmap representing cell cycle regulator genes dysregulated by MYCLo-2. The genes that are commonly regulated by MYC are indicated. Expression values displayed in gradient of red and blue are Log2-transformed fold change. The list of the dysregulated genes is available in Supplementary Table 4 (available online). G) Quantitative real-time polymerase chain reaction (qRT-PCR) results showing MYC-independent regulation of CDKN1A (left) and CDKN2B (middle) expression by MYCLo-1 knockdown (right). HCT116 cells were treated with 50nM siRNAs targeting MYC or MYCLo-1 for 72 hours. Data are mean ± SD of three independent experiments, measured in triplicate (††P = .003; §P = .0017; ∥P = .013; †P = .013; ‡P = .001; #P = .002; *P < .001). H) qRT-PCR results showing MYC-independent regulation of CDKN2B (left), CDKN1A, YWHAB, CFL1, and SFN (middle) expression by MYCLo-2 knockdown (right). HCT116 cells were treated with 50nM siRNAs targeting MYC or MYCLo-2 for 72 hours. Data are mean ± SD of three independent experiments and each measured in triplicate (**P = .03; ††P = .002; ∥P = .003; §P = .01; †P = .001; ‡P = .005; #P = .016; ¶P = .004; *P < .001). Statistical significance was determined by the unpaired two-sided Student’s t test.
