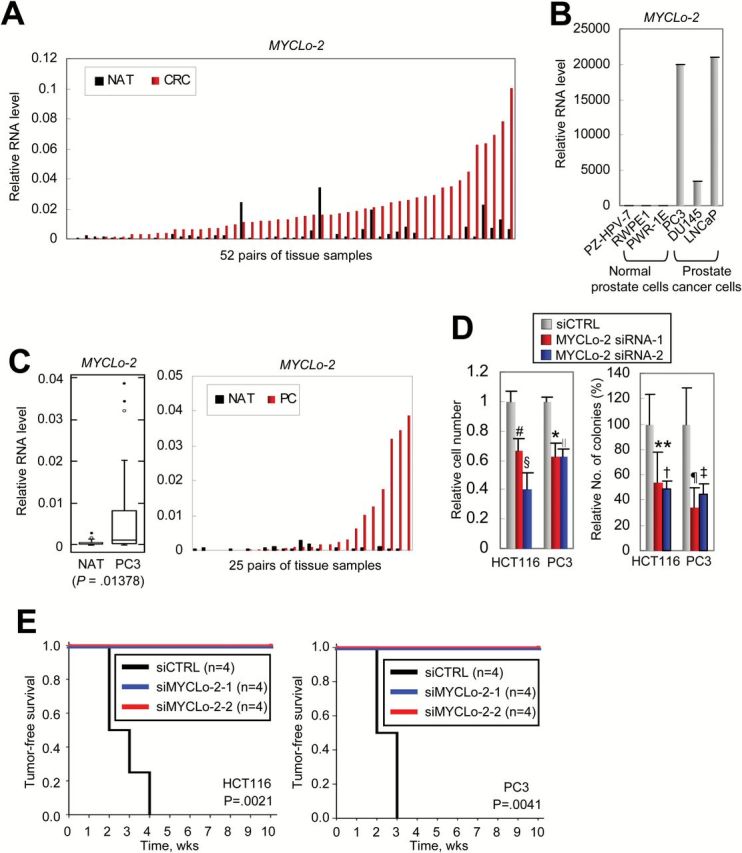
Figure 5.

Function of MYCLo-2 in cancer cell transformation and tumorigenesis. A) Comparison of expression level of MYCLo-2 in each pair of CRC tissues (red) and their matched normal adjacent tissues (NATs) (black). B) Quantitative real-time polymerase chain reaction (qRT-PCR) results showing significant overexpression of MYCLo-2 in PC-derived cell lines, compared with normal prostate-derived cell lines. Data are mean ± SD of three independent experiments and each measured in triplicate. C) Box and whisker plot (left) showing the significant overexpression of MYCLo-2 in PC, compared with their matched NAT (25 pairs of primary tissues). Comparison of expression level (right) of MYCLo-2 in each pair of PC tissues (red) and their matched NATs (black). D) Soft agar colony formation assays indicating that knockdown of MYCLo-2 causes a decreased number of cells (left) and colonies (right) in CRC-derived (HCT116) and PC-derived (PC3) cells. Data are mean ± SD of three independent experiments, each measured in triplicate (#P = .0066; §P = .00315; *P = .01185; ∥P = .00151; **P = .003322; †P = .001821; ¶P = .0107; ‡P = .02474). E) Kaplan-Meier plot of tumor-free survival analysis in athymic nude mice xenografted with siRNA-treated HCT116 (left) or PC3 (right) cells as indicated. The Kaplan-Meier method was used to estimate survival curves, and the log-rank test was used to test for differences between curves using SPSS Statistical Software (SPSS Inc., Chicago, IL).
