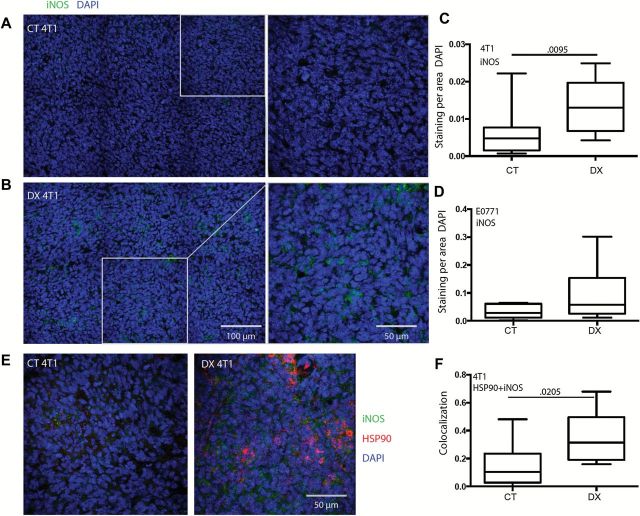
Figure 4.
Effect of MMP14 inhibition on iNOS expression in 4T1 tumors. A-C) Immunofluorescence staining of iNOS in 4T1 (A & B, representative images of control [CT] and DX-2400 [DX] treatment, respectively) revealed an increase with DX-2400 treatment at day 4 in 4T1 tumors (B). iNOS levels were not statistically significantly changed by DX-2400 treatment in the E0771 tumor model (D). E-F) HSP90 and iNOS expression. E) Representative images of HSP90 and iNOS immunofluorescent stains). HSP90, an essential cofactor and activator of iNOS, colocalization with iNOS also statistically significantly increased in the 4T1 tumor model (F). Scale bars are presented in the bottom right of each DX image and are the same for CT and DX images. Data are presented as median with the interquartile range (box) and maximum and minimum values (whiskers); n = 6 for E0771 samples, and n = 10 for 4T1 iNOS analysis, and n = 7 for HSP90+iNOS analysis. Statistical significance determined by two-sided Mann-Whitney test. Additional associated images and data are provided in Supplementary Figures 5 and 6 (available online). Note: y-axis scales in panels A and C are optimized for each tumor model. CT = control; DX = DX-2400.

