Figure 1:

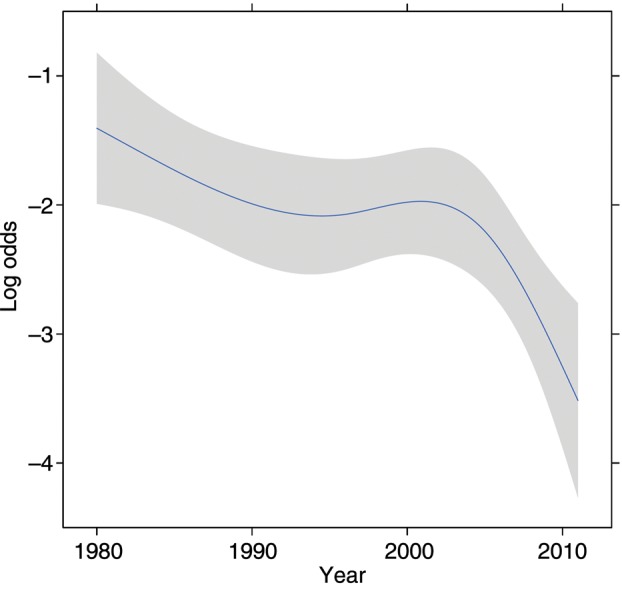
Trend line for postoperative pulmonary complications over time (adjusted for BMI, sex, age, coronary artery disease, PS and smoking status). The grey band represents 95% CIs.

Trend line for postoperative pulmonary complications over time (adjusted for BMI, sex, age, coronary artery disease, PS and smoking status). The grey band represents 95% CIs.