
FIG 4.
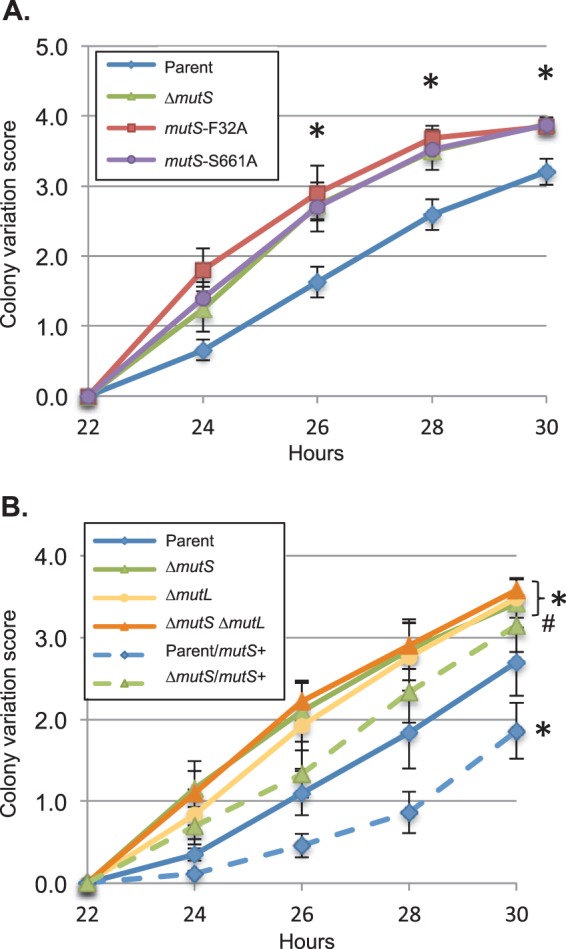
Pilin-dependent colony morphology changes (PDCMC) of MMC mutants. (A) PDCMC of the Kanr parent and the Kanr ΔmutS, mutS-F32A, and mutS-S661A derivatives grown in the presence of IPTG. Shown is the average of results from 5 to 7 assays (of 10 colonies each) with error bars representing the SEM. Statistical significance was determined using Student's two-tailed t test. Asterisks indicate P <0.001 relative to the parent strain for the indicated time point. There was no statistically significant difference between the ΔmutS, mutS-F32A, and mutS-S661A strains. (B) PDCMC assay of the parent and ΔmutS, ΔmutL, and ΔmutS ΔmutL derivatives grown in the presence of IPTG. The parent and mutants are depicted by solid lines, with a copy of the wild-type mutS+ gene at the NICS locus represented by a dashed line. Shown is the average of results from 5 to 6 assays (of 10 colonies each) with error bars representing the SEM. Statistical significance was determined using Student's two-tailed t test. Asterisks indicate P < 0.01, and # denotes P = 0.05 relative to the parent strain.