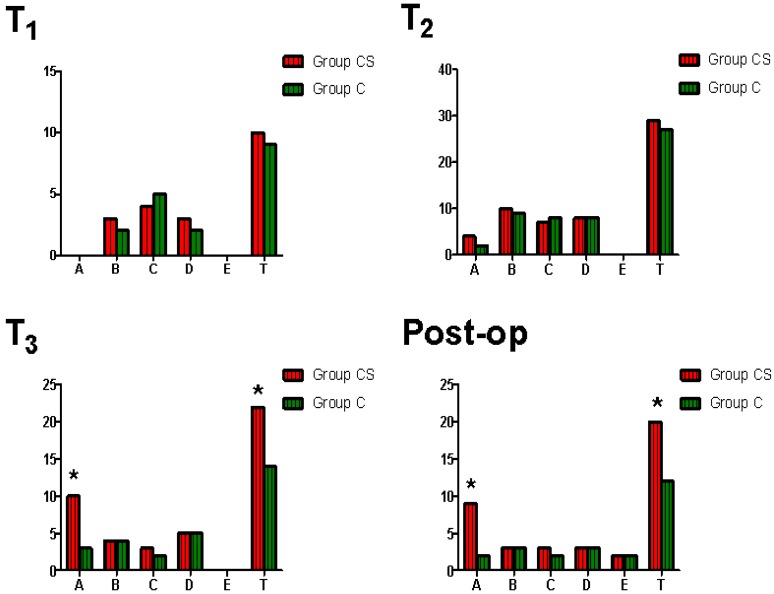
Figure 3.
Comparison of perioperative impairment of blood coagulative function between two groups. x-axis: type, A=residual heparin, B=hypocoagulability for low platelet, C=hypocoagulability for low FIB, D=hypocoagulability for low clotting factors, E=hyperfibrinolysis, T=total (A+B+C+D+E). y-axis: cases. T1 =at the time of after anesthesia induction and before surgery, T2=5 min after heparin was neutralized with protamine during surgery, T3=at the end of surgery, post-op=in the 24 hours after surgery. *p=0.025 (T3-A), 0.037 (T3-T), 0.018 (post-op-A), 0.042 (post-op-T), respectively.

