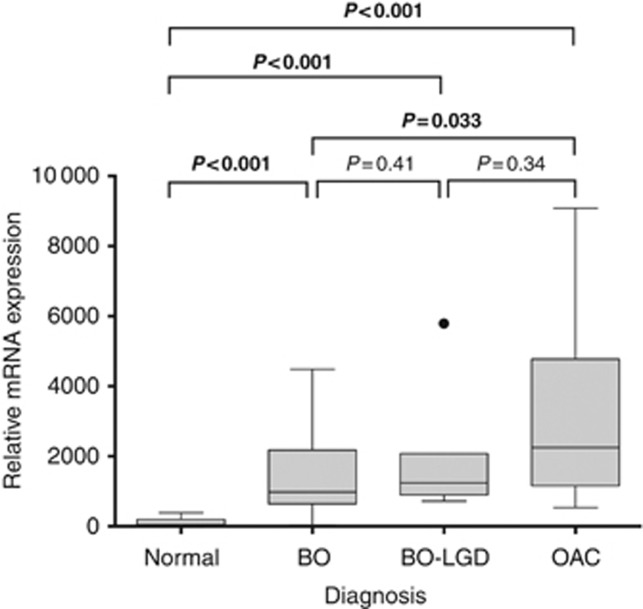
Figure 1.
Boxplot of tissue MIC-1/GDF15 mRNA expression analysis by pathology diagnosis. Raw relative mRNA expression values are presented. Differences in relative gene expression values were calculated using Student's t-test following log2 transformation. Bold values indicates that these are statistically significant. Dot indicates outlier as is convention for presenting boxplot data.

