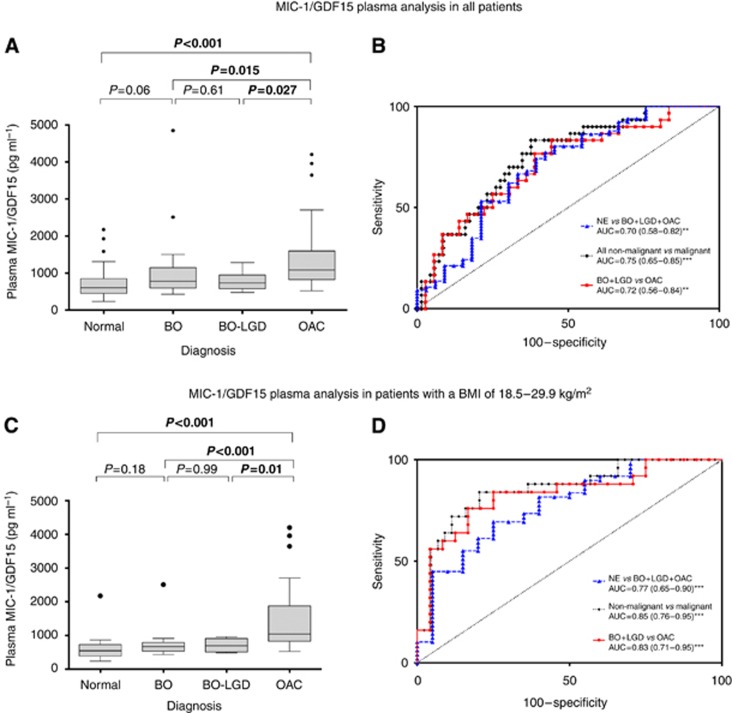
Figure 2.
Boxplots of MIC-1/GDF15 plasma levels by pathology diagnosis and corresponding receiver operator characteristic (ROC) curves for performance analysis of tissue MIC-1/GDF15 plasma levels to discriminate patient groups. (A and B) Show the analysis of the whole study cohort, whereas (C and D) depict the findings in the non-obese, non-underweight (as categorised by the WHO) patient population. Differences in plasma values were calculated using Student's t-test following log2 transformation. Data are presented untransformed as pg ml−1. Bold values indicates that these are statistically significant. Dot indicates outlier as is convention for presenting boxplot data. **P<0.01; ***P<0.001.

