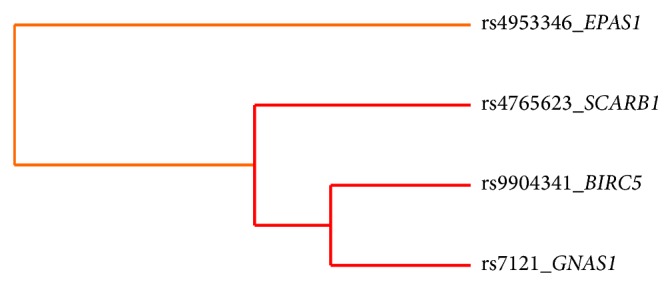
Figure 1.

Interaction dendrogram provided with MDR analysis. Dendrogram interaction graphs are built using hierarchical cluster analysis and illustrate the presence, strength, and nature of epistatic effects. The more the line connecting two factors is moved to the right side, the stronger the interaction effect is. The red line between factors indicates a high degree of synergy whereas the orange line indicates a lesser degree of synergy.
