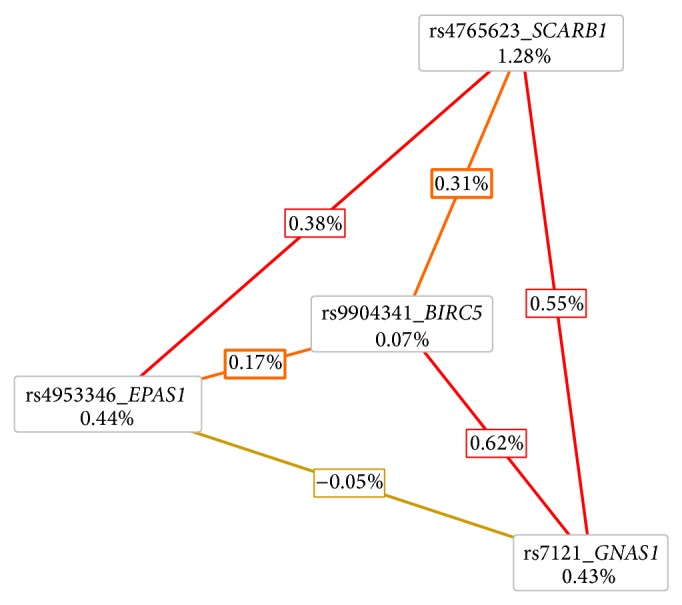
Figure 2.

Entropy-based interaction radial graph provided with MDR analysis. Entropy values in the cells of individual factors indicate the main independent effects whereas the entropy values marked on the lines connecting two factors represent the effect of interaction.
