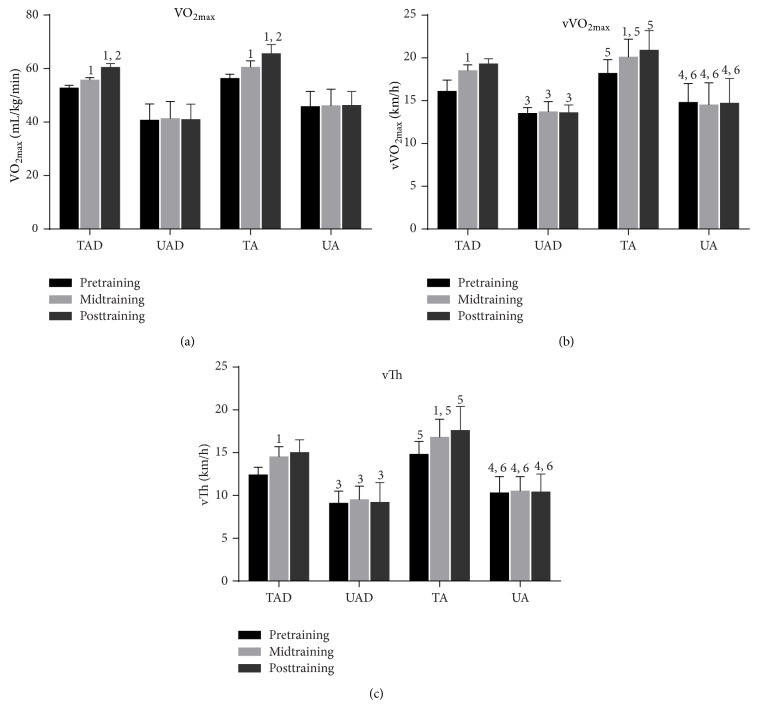
Figure 2.
Performance changes during the experimental period. VO2max, maximal oxygen consumption; vVO2max, velocity at maximal oxygen consumption; vTh, ventilatory threshold; TAD, trained adolescents; TA, trained adults; UAD, untrained adolescents; UA, untrained adults; 1a significant difference with baseline (P < 0.05); 2a significant difference between midseason and end-season (P < 0.05); 3a significant difference between adolescent groups at the corresponding time point (P < 0.05); 4a significant difference between adult groups at the corresponding time point (P < 0.05); 5a significant difference between trained groups at the corresponding time point (P < 0.05); 6a statistical difference between control groups at the corresponding time point (P < 0.05).

