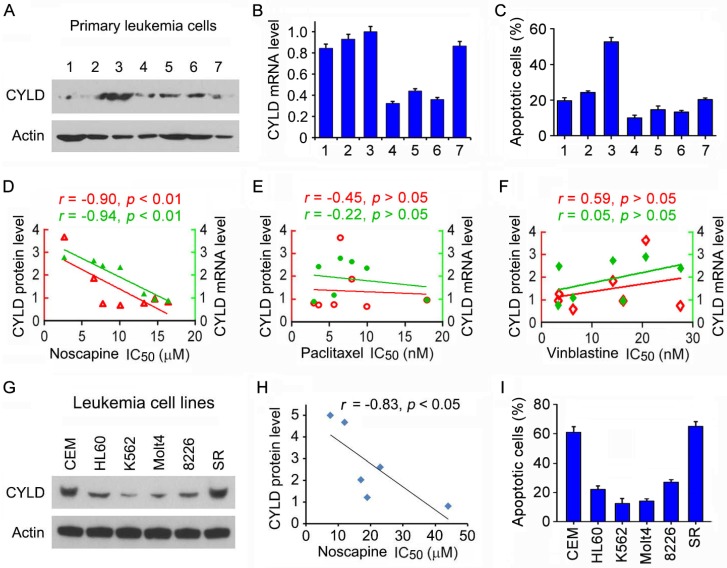
Figure 1.
CYLD expression correlates with noscapine activity both in cell lines and in primary cells of leukemia. (A) Immunoblots showing CYLD and β-actin expression in primary leukemia cells from 7 ALL patients. (B) Quantitative real-time RT-PCR analysis of CYLD mRNA expression in primary leukemia cells. (C) Primary leukemia cells were treated with 2 μM noscapine for 48 hours, and the percentage of apoptotic cells were quantified by nuclear staining. (D-F) Correlation analysis between the IC50 value of noscapine (D), paclitaxel (E), or vinblastine (F) and CYLD protein or mRNA level in primary leukemia cells. CYLD protein level was determined by densitometric analysis of the blots shown in A. (G) Immunoblots for CYLD and β-actin expression in 6 different leukemia cell lines. (H) Correlation analysis between the IC50 value of noscapine and CYLD protein level in 6 leukemia cell lines. (I) Leukemia cell lines were treated with 2 μM noscapine for 48 hours, and the percentage of apoptotic cells were quantified by nuclear staining.

