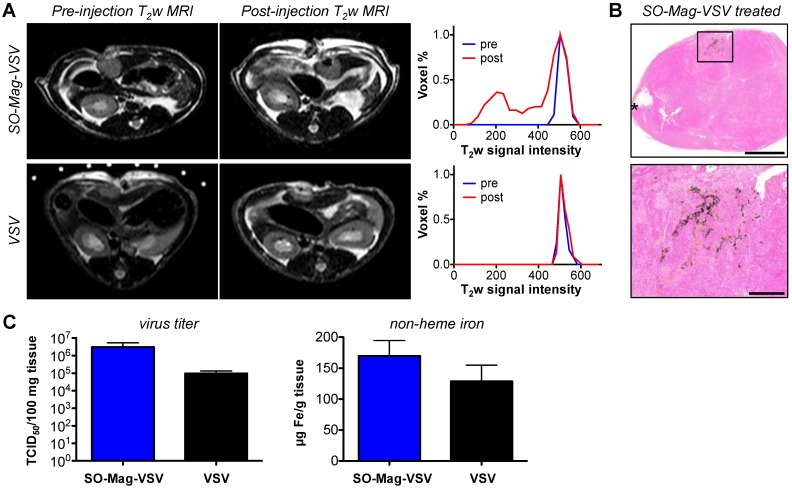
Figure 9.
In vivo targeting of SO-Mag-VSV complexes. A Pre- and 24 hour post-injection T2-weighted MR images of orthotopic HCC after SO-Mag-VSV complex (top row) or naked VSV (bottom row) injection. The corresponding histograms (A, right) illustrate the signal loss after magnetic complex application in an emerging signal shoulder in the lower signal range. B Overview (top) and high magnification micrographs of prussian blue staining 24 hours after SO-Mag-VSV complex injection. The asterisk marks the injection site and the magnet was placed above the boxed area (top); scale bars 2,000 µm (top) and 500 µm (bottom), respectively. C Intra-tumoral virus titer and non-heme iron of whole tumors sampled 30 minutes post infection with SO-Mag-VSV complexes (n=4, blue) and naked VSV (n=3, black).

