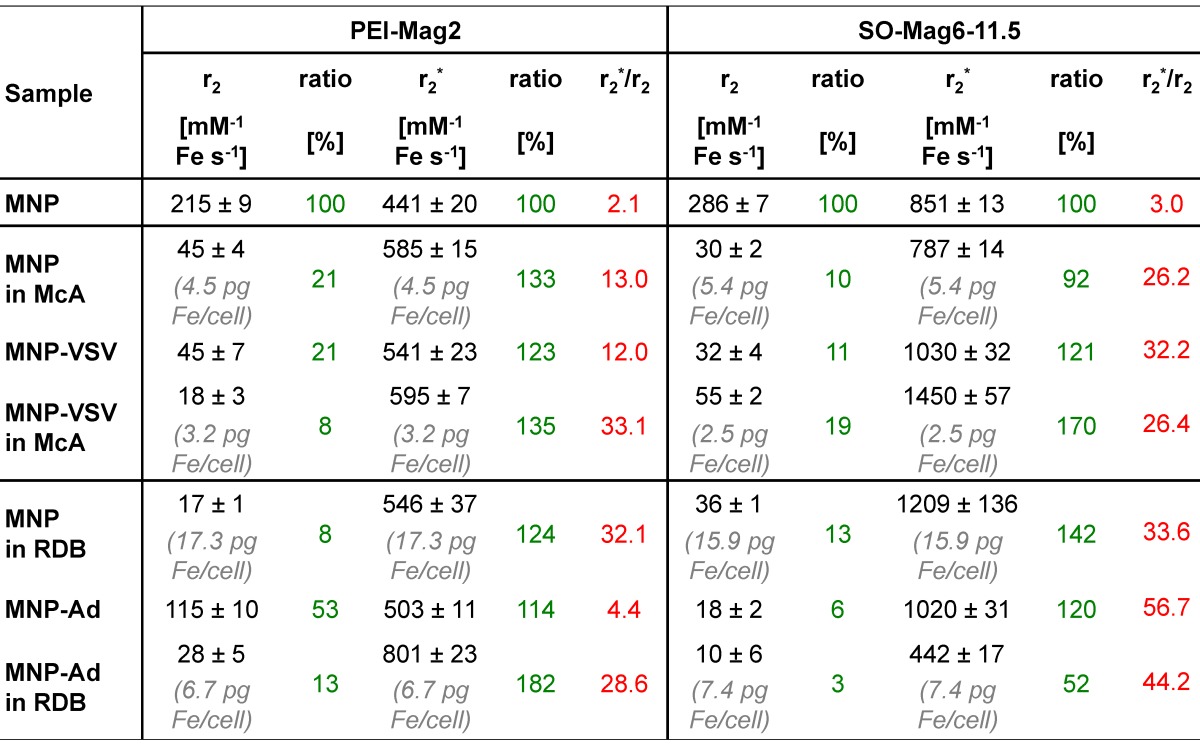
Table 5.
r2 and r2* relaxivities of the MNP assemblies. The table shows the r2 and r2* relaxivity data of the free MNPs and MNP-VP complex assemblies in liver-mimicking agarose phantoms, and the ratios of the nanoassembly relaxivity normalized to the relaxivity of free MNPs (r2/r2(MNP) and r2*/r2*(MNP), respectively, green) and the r2*/r2 ratios (red). All measurements were performed using a clinical 1.5 T MRI system from Philips.

