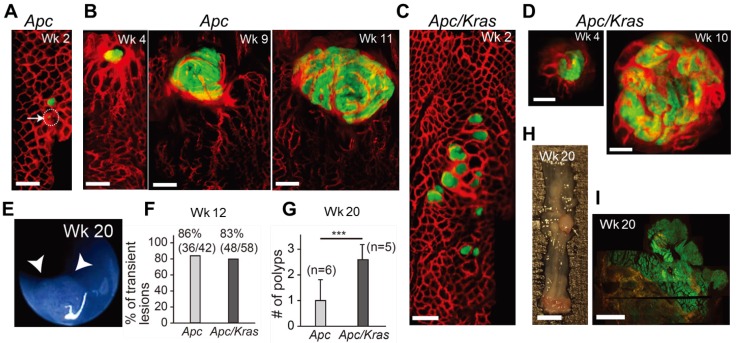
Figure 1.
In vivo visualization of the natural evolution of colorectal tumors following conditional genetic modification in situ. A, In vivo confocal fluorescence image showing two GFP-positive lesions (green) in the colon of an Apc mouse at week 2 after adeno-cre administration. Blood vessels were visualized with TRITC-Dextran (red). Arrow and dotted circle indicate the eGFP expression at the single-cell level. B, Time-lapse images of a growing adenoma in an Apc mouse. C, In vivo image of a group of GFP-positive micro-adenomas in the colon of an Apc/Kras mouse at week 2. D, Time-lapse images of a continuously growing adenoma in an Apc/Kras mouse. E, A colonoscopy image showing a polyp in an Apc mouse at week 20. F, The percentage of transient lesions among the total lesions. The remaining lesions became polyps. G, The number of polyps per mouse was counted at week 20. Error bars represent standard deviations. ***, P < 0.001. The number (n) of mice is indicated. H, Excised tissue section showing a polyp at week 20. I, Fluorescence immunohistochemistry image of a eGFP-positive macro-adenoma. Scale bars, 250 µm in A-D, 5 mm in H, and 1 mm in I.

