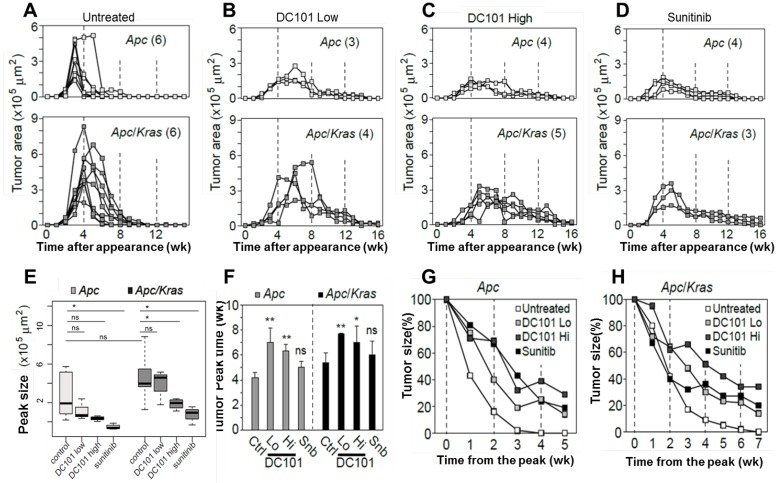
Figure 3.
Quantitative time-lapse measurement of transient micro-adenomas after anti-angiogenic treatment. A-D, The measured growth curves of individual eGFP-positive lesions in the Apc (upper panel) and Apc/Kras (lower panel) mice in different treatment groups: (A) non-treated control and treated with (B) low-dose DC101 (10 mg/kg), (C) high-dose DC101 (40 mg/kg), and (D) sunitinib (40 mg/kg). The numbers in parentheses in (A-D) indicate the number of microadenoma examined for each case. E, The maximum tumor area from each mouse was measured from the longitudinal monitoring data in Fig. 3A-D. The differences between animal groups were statistically analyzed using Wilcoxon rank sum test. ns, not significant; *, P < 0.05.F, The time point of maximum growth of micro-adenomas after genetic mutation. ns, not significant; *, P < 0.05; **, P < 0.005. G-H, Regression curve of tumor size normalized to the peak size for (G) Apc and (H) Apc/Kras mice.

