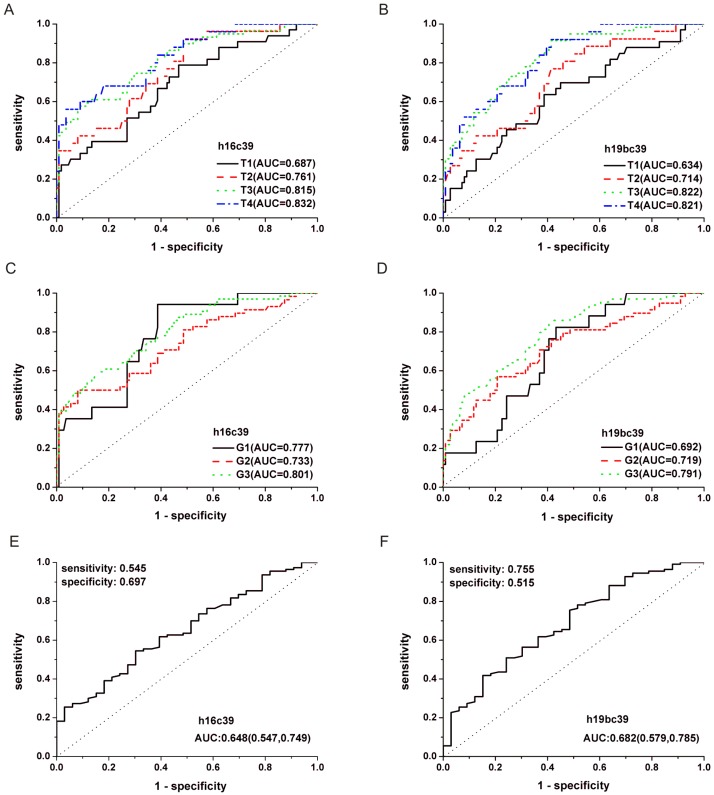
Figure 6.
ROC curves for miR-16-5p (A, C, E) and miR-19b-3p (B, D, F) normalized to the exogenous miRNA in the total training and validation phases. (A, B) Curves to respectively distinguish GC cases with different TNM stages from N controls. (C, D) Curves to respectively distinguish GC cases with different differentiation grades from N controls. (E, F) Curve to distinguish GC cases with T1 stage from those with the others. T1-4 and G1-3, as stated in Table 3; h16c39 and h19bc39, as stated in Fig. 3.

