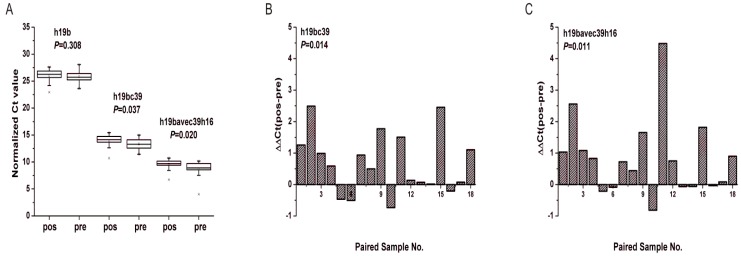
Figure 8.
Expression levels of miR-19b-3p in the supplementary phase Ⅱ. (A) Boxcharts of the expression levels of miR-19b-3p. Mann-Whitney U test was used to determine statistical significance at the level of P<0.05. (B, C) Column charts of the differential expression levels of miR-19b-3p between pre-operative gastric cancer patients (pre) and post-operative ones (pos). ΔΔCt(pos-pre) denotes the difference of the normalized Ct value. Paired Wilcoxon test was used to determine statistical significance at the level of P<0.05. h19b, h16c39, h19bc39 and h19bavec39h16 were stated as in Fig.3.

