
Figure 1.
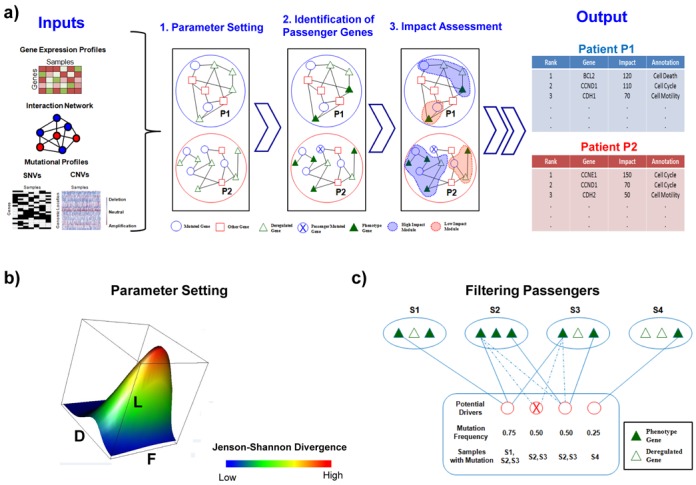
A schematic representation of OncoIMPACT's algorithmic framework. (a) Overview of OncoIMPACT's workflow involving three main stages of data-processing. (b) Depiction of OncoIMPACT's search through a multi-dimensional space to set network and expression parameters (F, fold change of genes; L, length of path; D, degree of nodes). (c) Parsimony-based matching of potential driver and phenotype genes in a bipartite graph to eliminate back-seat drivers. Solid and dashed lines indicate the association of potential driver genes to phenotype genes that were accepted and rejected, respectively.