
Figure 5.
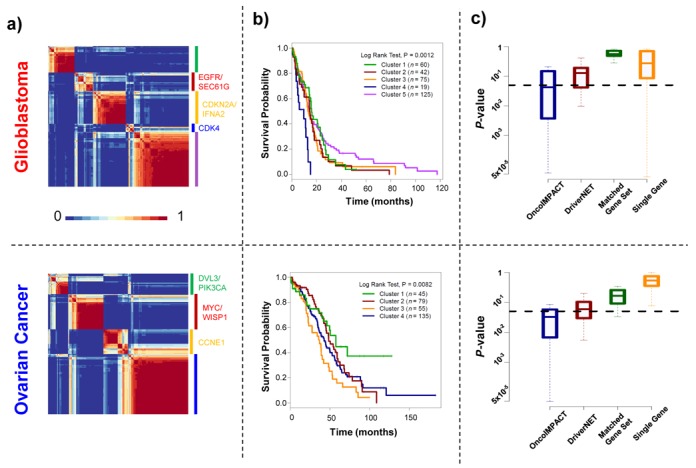
Tumor stratification using predicted driver gene profiles. (a) Heatmaps depicting consistency of clustering (fraction of bootstrap replicates in which patients clustered together) for predicted driver gene mutational profiles (binary 0–1 vectors) using NMF. (b) Survival profiles of glioblastoma and ovarian cancer patients stratified by consensus clustering in (a). (c) Box plots showing the distribution of P-values (log rank test) for survival profiles of random subsets of glioblastoma (sample size 275) and ovarian cancer (sample size 250) patients, clustered into the same number of groups using different gene signatures (OncoIMPACT predicted driver genes; DriverNET predicted driver genes; Randomly selected sets of genes of the same size as OncoIMPACT predicted drivers; Randomly selected single genes).